
Tallebudgera Valley property market
How many homes are for sale, what just sold, how long homes are taking and the market charts for Tallebudgera Valley, with our research that covers the whole southern Gold Coast.
Tallebudgera Valley right now
Our records, 3 Nov 2026What brings you to Tallebudgera Valley?
Tallebudgera Valley's market analysis is published as part of Tallebudgera & Tallebudgera Valley, with each suburb on its own figures.
Sell-now-or-wait analysis and buyer conditions are published for Robina, Varsity Lakes and Burleigh Waters so far.
Videos from Will





Research from across the coast
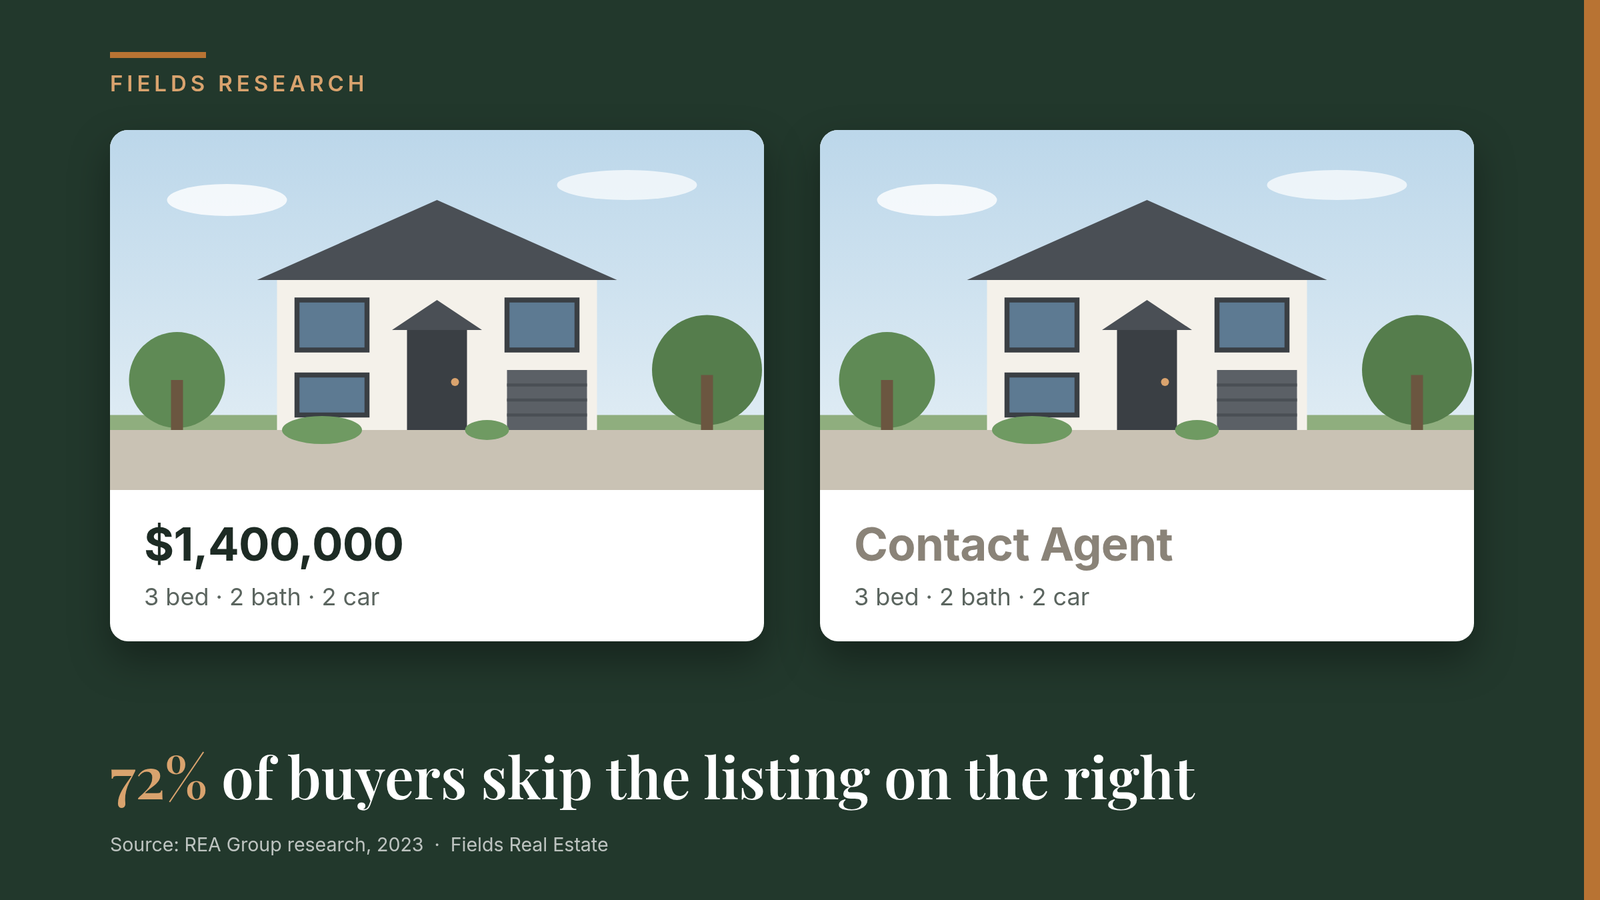 72% of buyers skip a home with no price. About one in three local listings doesn't show oneREA Group research found 72% of buyers skip listings that don't include a price. As at 7 October 2026, 68 of 213 homes for sale in Robina, Varsity Lakes and Burleigh Waters showed no dollar figure.7 Oct · 6 min read
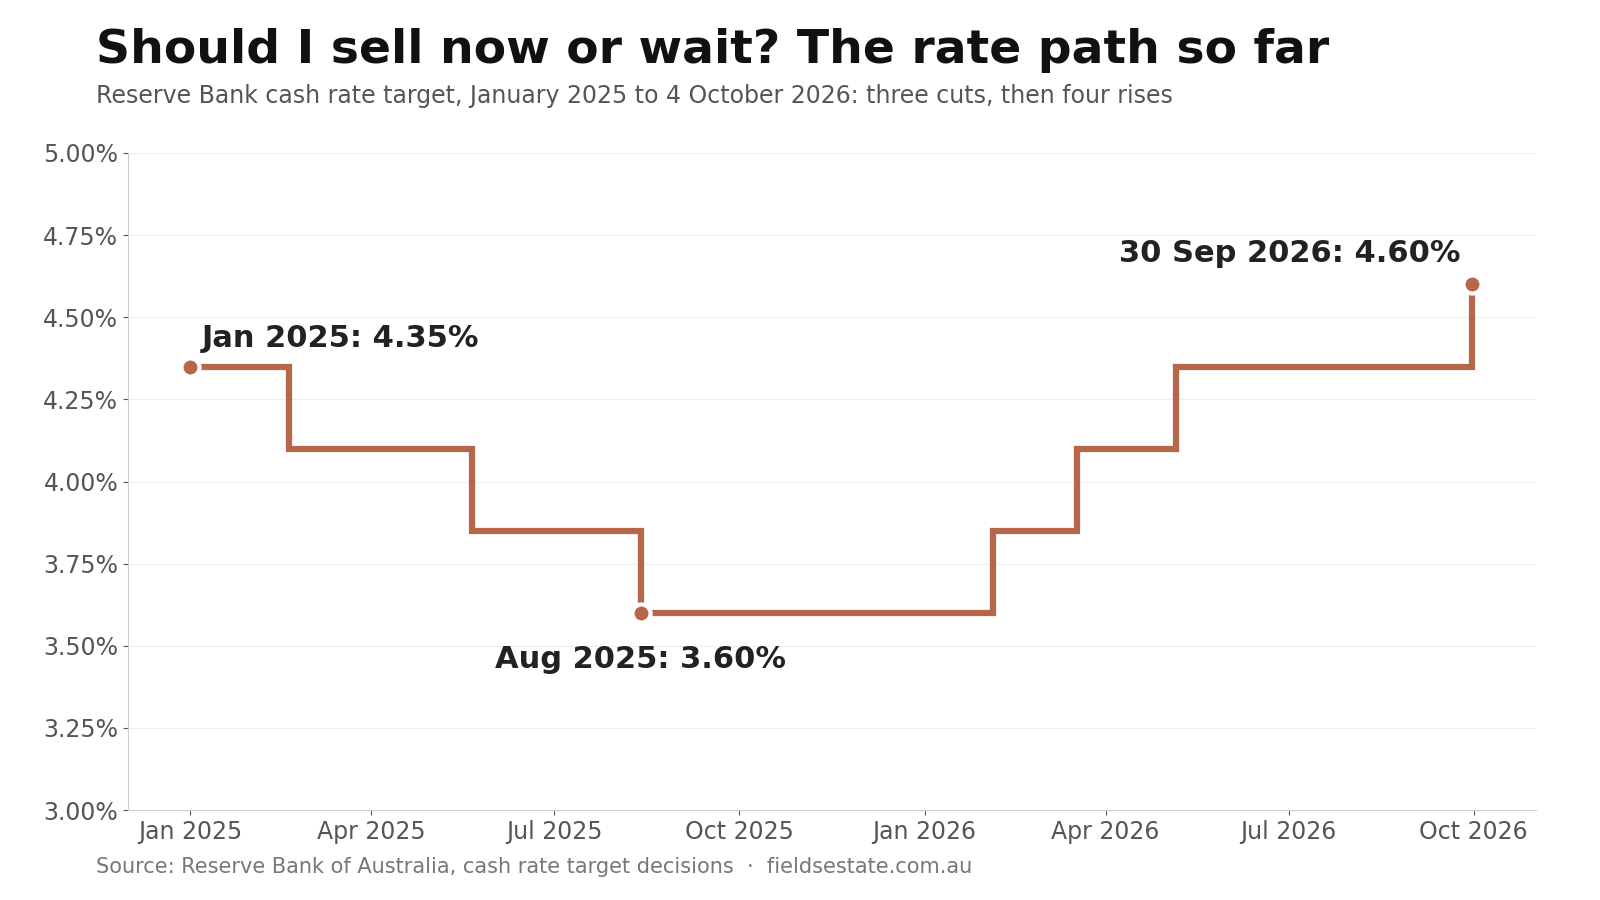 Should I Sell Now or Wait? What the Gold Coast Data Can and Cannot AnswerNo data set can tell a particular household whether to sell now or wait. What it can show: the cash rate went from 4.35% down to 3.60% and up to 4.60% in twenty-one months, a general price move lands on both sides of a sell-and-buy trade, and Gold Coast homes unsold after 60 to 180 days rose from 1,288 to 2,618 between March and August.4 Oct · 8 min read
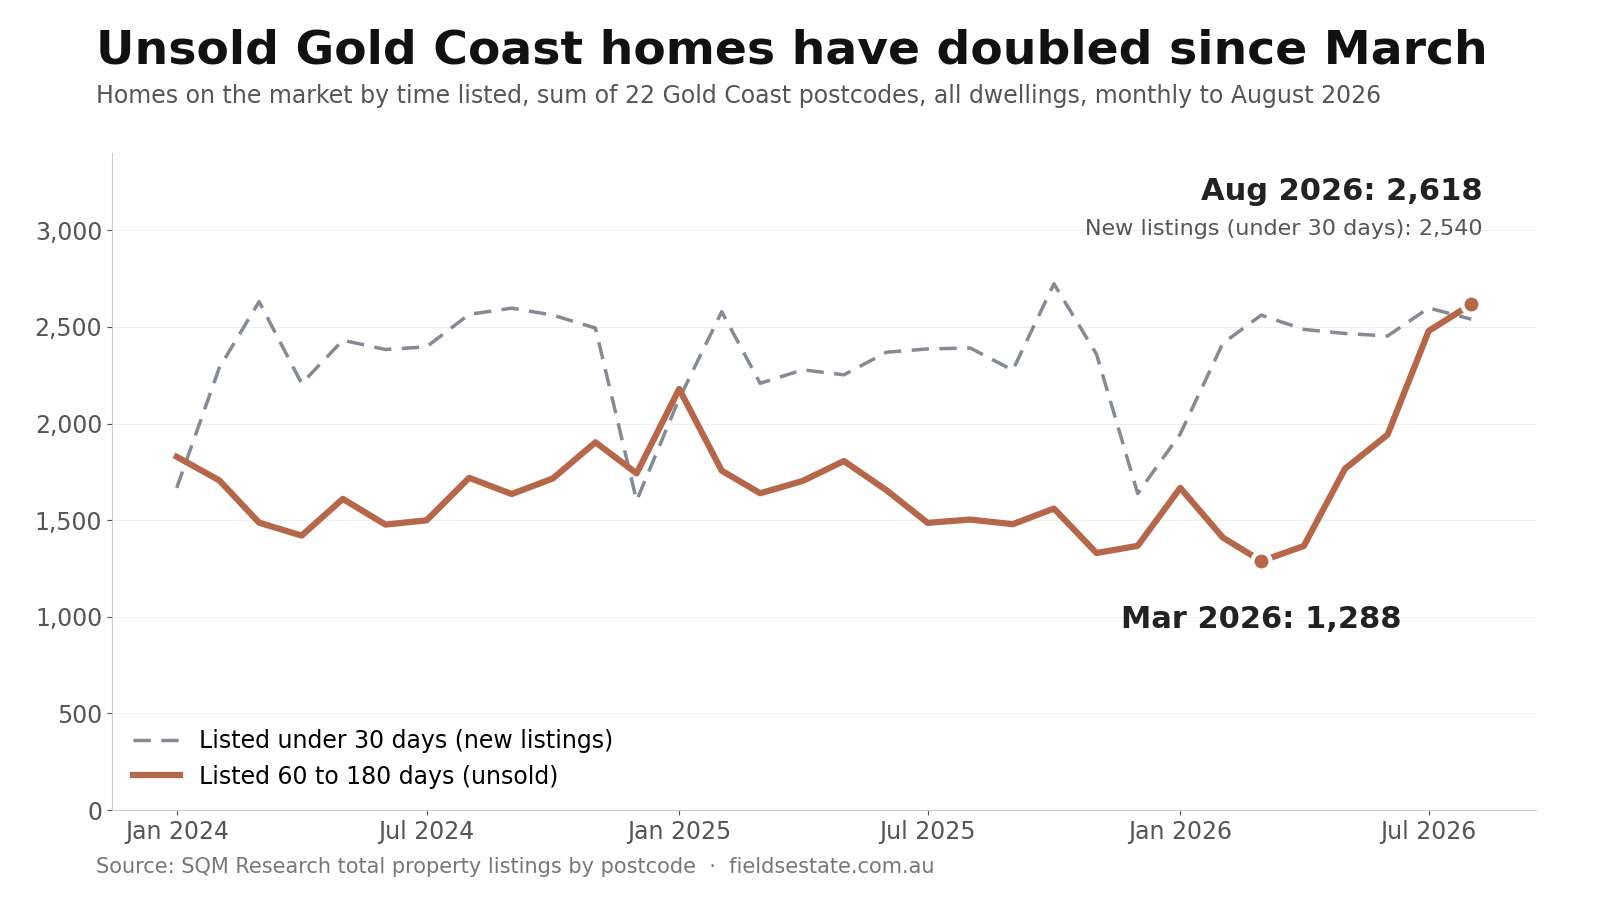 Unsold Gold Coast Homes Have Doubled Since March: The Indicators That Move Before Prices DoGold Coast homes listed for 60 to 180 days rose from 1,288 in March to 2,618 in August, while new listings stayed flat. What unsold stock, selling times and home lending are reading now, and what they did the last time they moved together.28 Sep · 7 min read
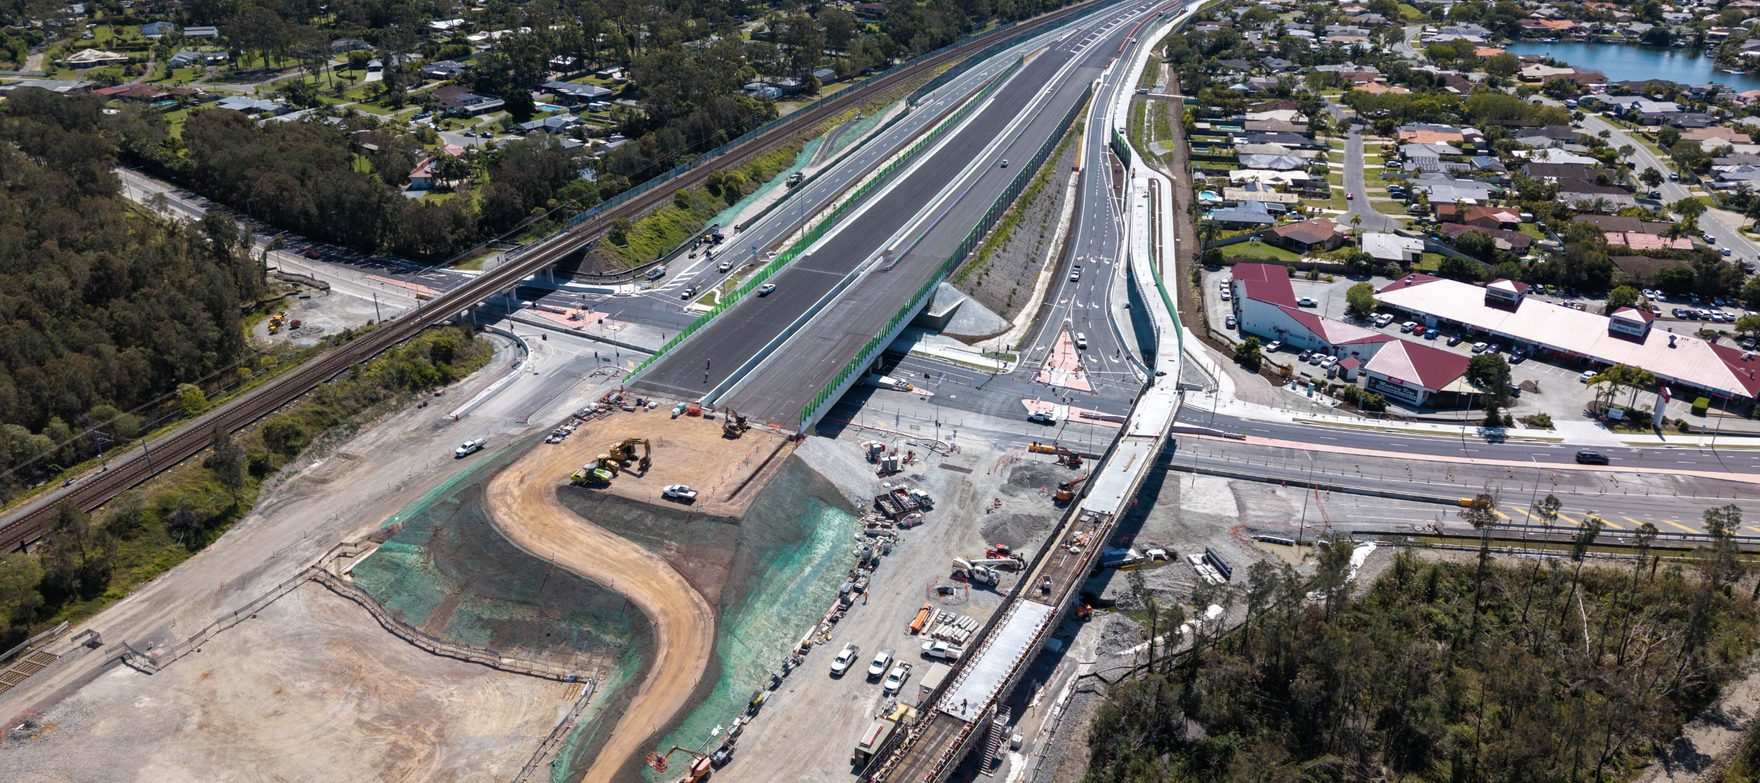 The Coomera Connector: What the Modelling Says About M1 Traffic, and What Motorways Have Done to House PricesIt isn't the M1 upgrade — it's a second motorway, and a quarter of Stage 1 is open. What the government's modelling says it will do to peak-hour drive times and M1 traffic, what research on other new motorways found about house prices, and what homes along the Coomera-to-Nerang corridor have sold for.22 Sep · 14 min read
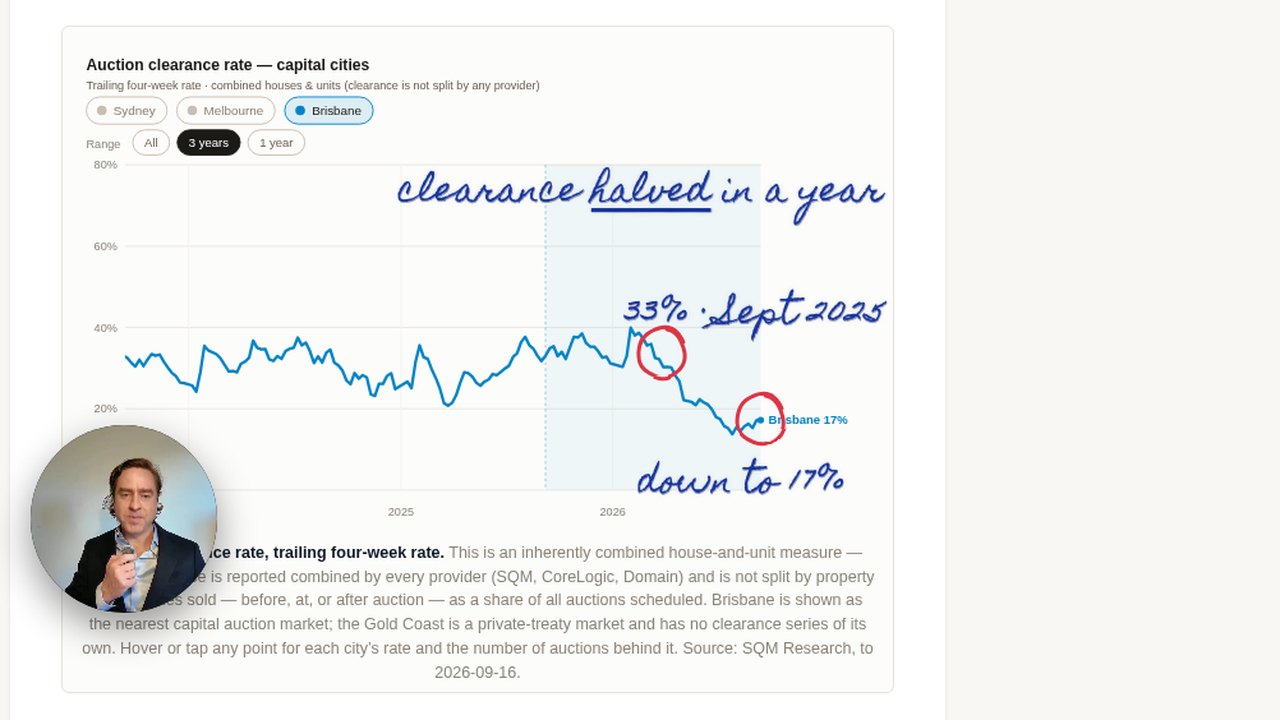
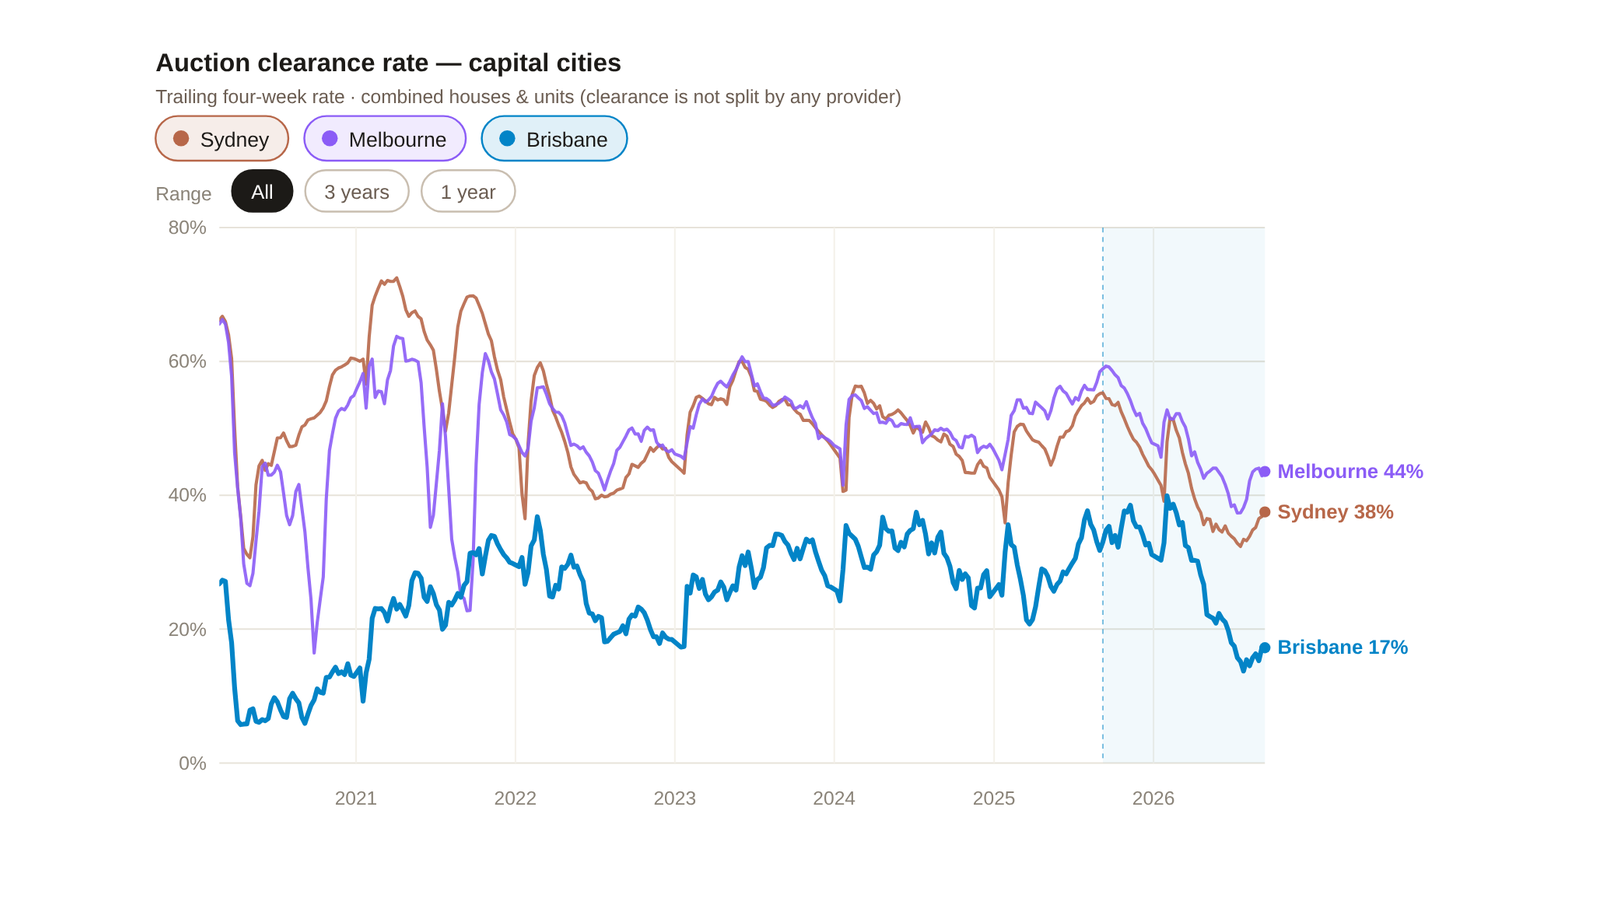 The auction market has halved in a yearAcross our region, the share of homes selling under the hammer has fallen from about one in three a year ago to roughly one in six today — what the numbers show, and two things about auctions most buyers and sellers never see.17 Sep · 4 min read
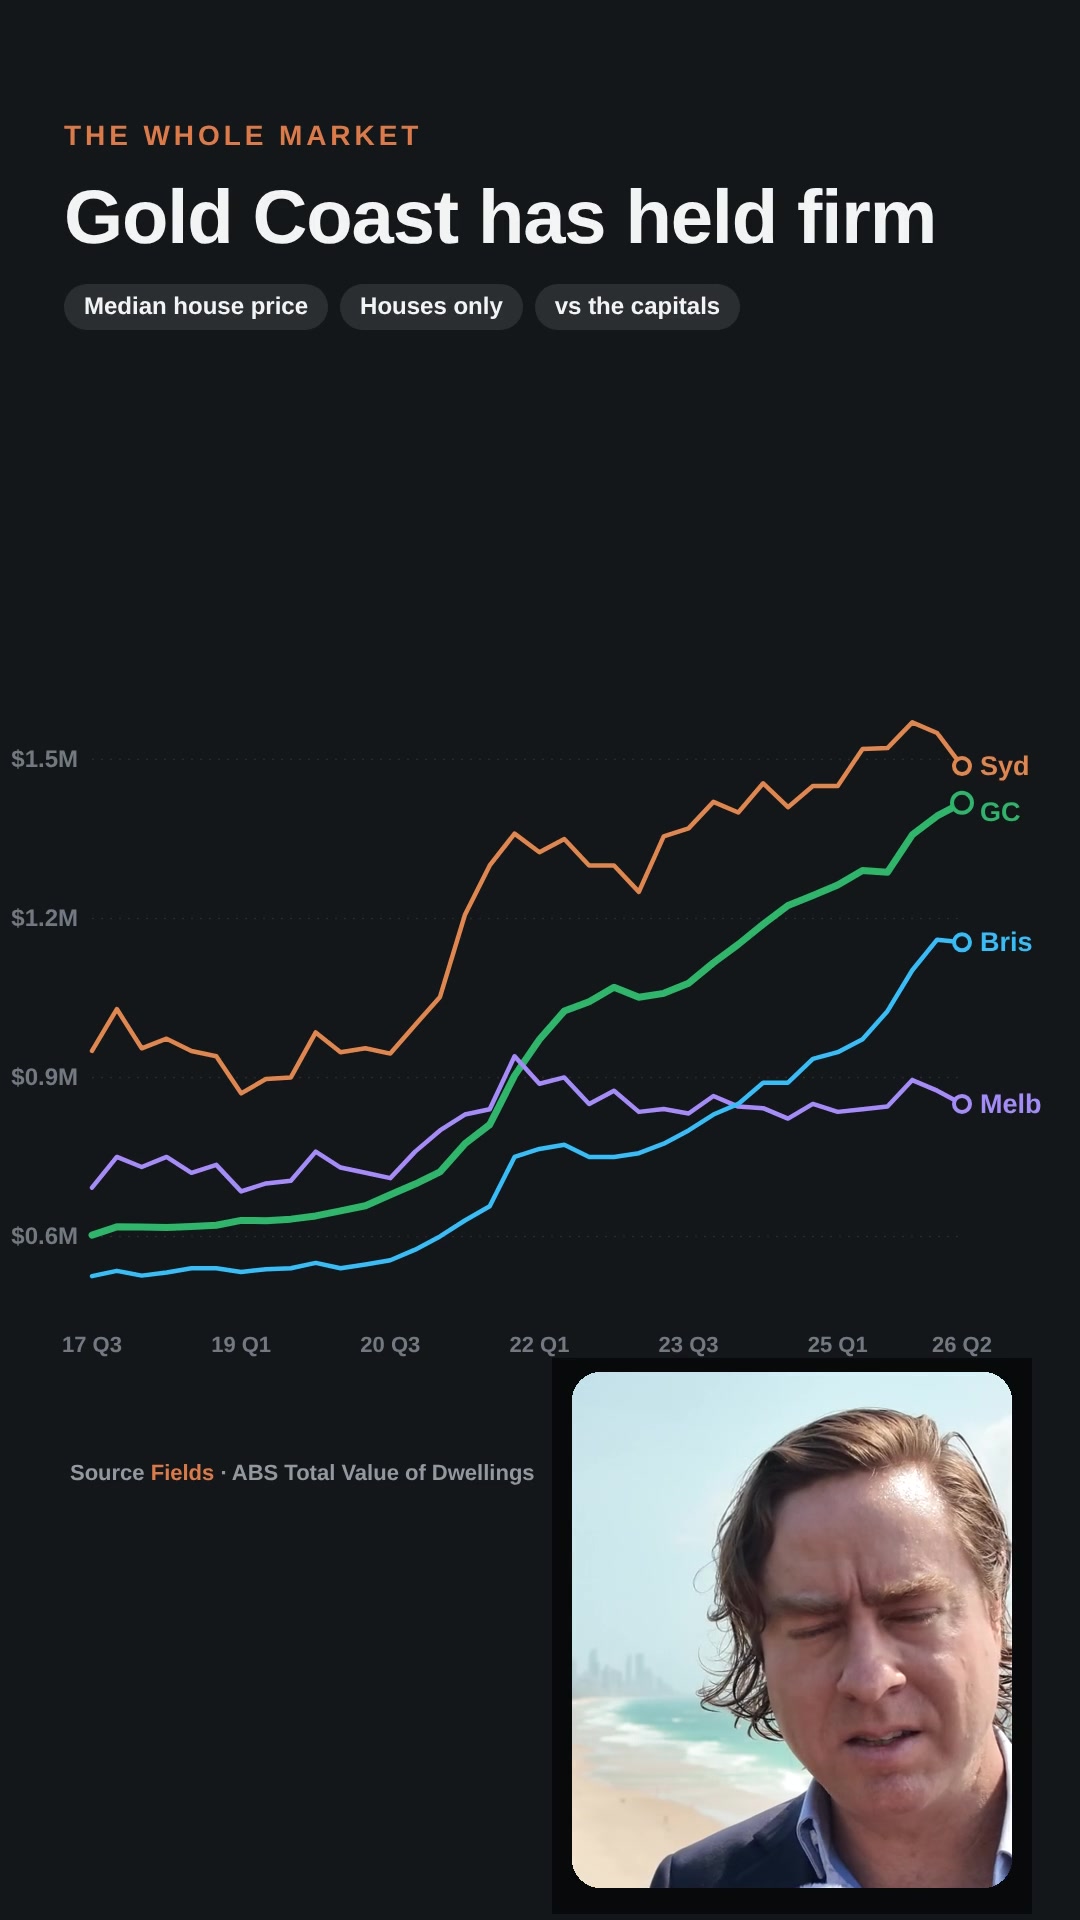
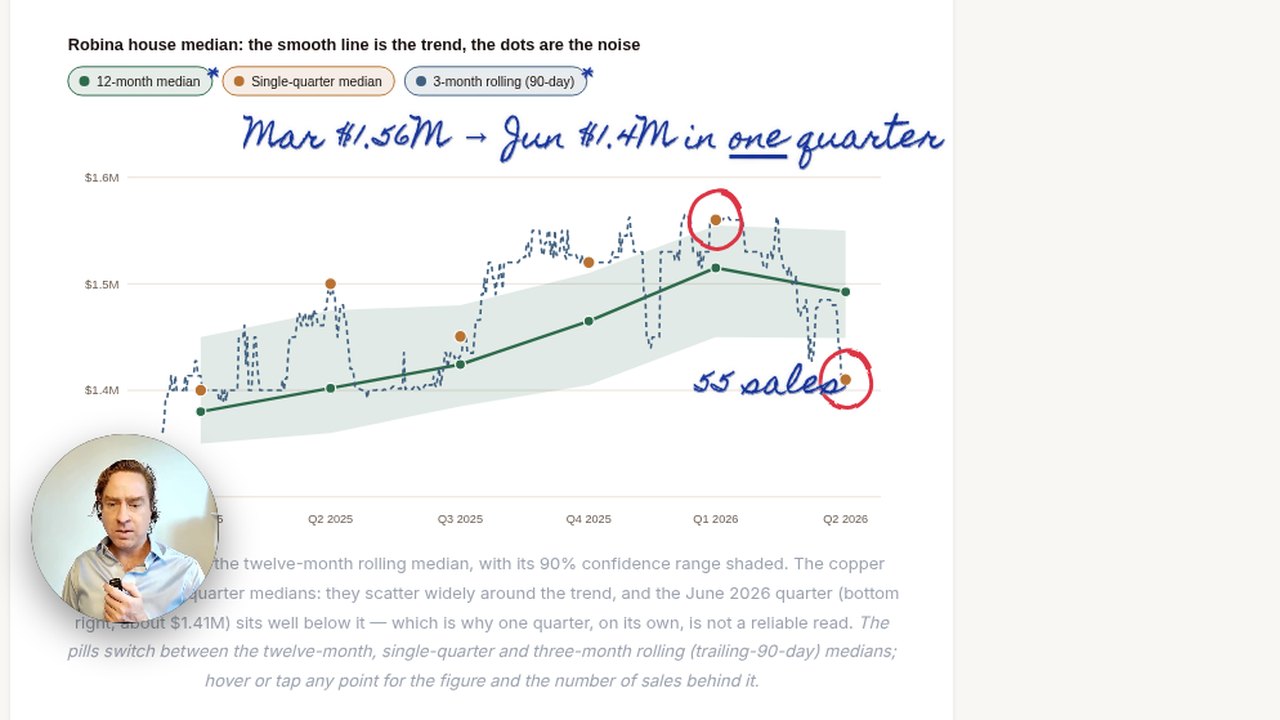
 Prices are falling across the country. Will the Gold Coast fall too?National values are falling — but the southern Gold Coast's own records have risen. The market-update we prepare for a single home, written for the region: what the record shows, and the indicators that move before prices do.27 Aug · 10 min read
Reading the market

Or go straight to Analyse your home.
Tallebudgera & Tallebudgera Valley market analysis
Houses, from our sales records, mostly over rolling 12 months. That is a different base from the snapshot above (every property type, the last 90 days to 6 months), so the figures differ.
Every figure below is that suburb's own; none is pooled across suburbs. Choose a suburb to read its full analysis below.
| Suburb | Median house price | Sales in median | Days on market12 months | Houses for sale |
|---|---|---|---|---|
| — | — | — | — | |
| — | — | — | — |
— means too few sales in that suburb to state the figure.