What do comparable sales say about your home?Your home vs recent sales
Enter your address to see the comparable sales around it. Free, no sign-up.Free comparable sales for your address.
🔍
Analyst27 August 2026·Updated 15 September 2026·10 min read
Prices are falling across the country. Will the Gold Coast fall too?
National values are falling — but the southern Gold Coast's own records have risen. The market-update we prepare for a single home, written for the region: what the record shows, and the indicators that move before prices do.
You have read that house prices are falling. Nationally, that is true. On the Gold Coast, so far, it is not. This is the same market-update we prepare for a single home — the national turn, what the local record actually shows, and the indicators that move before prices do — written here for the southern Gold Coast as a whole rather than one address.
The southern capitals are falling, and Brisbane has slipped too
The turn is no longer theoretical; it is showing up in the data. National home values fell 0.7% in July 2026 — the sharpest monthly decline since December 2022. Sydney and Melbourne led the falls, down 1.4% and 1.2%, while Brisbane declined 0.6% and Adelaide edged 0.2% lower (Cotality, July 2026). The pressure is coming from stubborn inflation and higher rates: the RBA cash rate remains at 4.35% after increases in February, March and May, while annual headline inflation reached 3.8% and trimmed-mean inflation 3.6% in the June quarter (RBA; ABS). Buyers are less confident, too — Westpac's House Price Expectations Index fell 8% in July to a three-year low, though almost half of respondents still expected rises (Westpac–Melbourne Institute, July 2026).
So why are they falling? Not one reason but several arriving at once. The Reserve Bank raised interest rates three times in the first half of 2026 — pushed to by a spike in global oil prices after a Middle East conflict lifted inflation again — and dearer money cut how much buyers can borrow, which is why the most expensive homes fell first. With prices already stretched against incomes and confidence sliding, the May budget's changes to negative gearing and capital gains tax then pulled some investors out of the market. That tax change is often blamed for the turn, but the timing tells against it: prices had already begun falling before the budget, and the measures do not take effect until 1 July 2027 — it sharpened the fall rather than caused it.
Yet the Gold Coast has so far not followed. Prices across the southern suburbs have held — risen, even — while the national market fell. The question that raises is whether it lasts: does the Gold Coast keep defying the national move, or eventually turn with it? Let us work through it the way an analyst would, in four steps — whether local prices are falling now, whether buyer demand is turning, why the two markets can move differently, and which forces could shape prices from here.
1. Are Gold Coast prices falling right now?
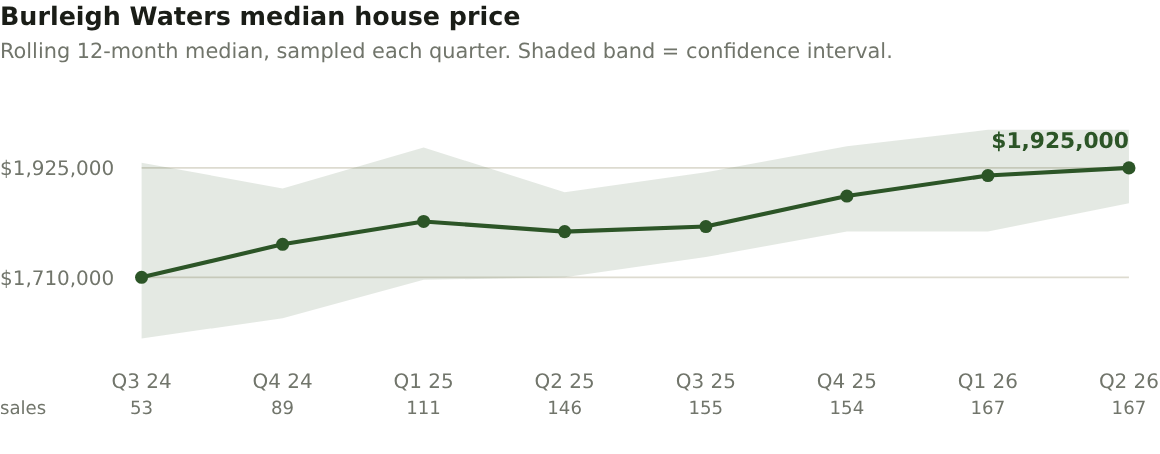
Start with the record itself, compiled from public sale records across the twelve months to 2 August 2026. These are rolling 12-month house medians — each is the median of the previous year of recorded sales, so it reflects transactions that actually happened rather than an estimate.
Rolling 12-month house medians, year to 2 August 2026
Suburb
Median house price
Year-on-year
Sales behind it
Robina
$1,490,000
+5.8%
112
Varsity Lakes
$1,400,000
+10.2%
58
Burleigh Waters
$1,925,000
+6.9%
42
All three recorded medians sit higher than a year earlier, not lower. That is the backward-looking half of the picture — a price confirms what buyers have already done, not what they are about to do. For the more forward-looking signal, we look at how quickly homes are selling.
Figure One — Because each point covers a full year of sales, the line is a smoothed trend, not a quarter-by-quarter movement; read the direction over time, not the step between two points. The number under each point is how many sales it's based on. Source: Fields, compiled from public sale records.
2. Is buyer demand turning?
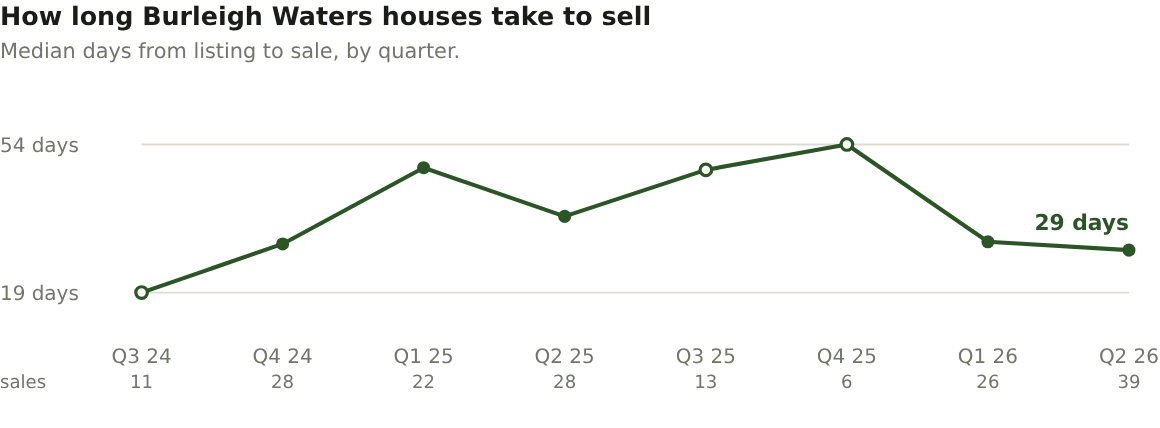
Days on market is the demand signal that tends to move before price: low numbers mean homes are being absorbed quickly, higher numbers mean buyers are taking their time. Last quarter the median house took 34 days to go under offer in Robina, 29 in Burleigh Waters and 26 in Varsity Lakes — toward the quick end of each suburb's recent record. Housing-market research finds that as demand eases, homes take longer to sell before the median price itself gives way — and here that leading signal has not yet turned.
Figure Two — The number under each point is how many sales it is measured from. A median holds up on a sample of the market; a count of sales does not, so no sales total is reported here as a market figure. Hollow points (Q3 24, Q3 25, Q4 25) rest on fewer than 15 sales — shown, but not firm enough to lean on. Source: Fields, the same figure shown on our Market Intelligence pages.
So the forward-looking signal and the backward-looking one point the same way for now: prices still rising, homes still selling briskly. That is not a market in retreat — but time on market is the number to watch, because buyer demand tends to turn before price does. Price figures alone cannot tell you where things go next. For that you have to look underneath them, at the demand that drives a market: who is moving here, whether there is work, and what people can afford.
3. Why is the Gold Coast holding up differently?
Two records point different ways at once: nationally, values are falling — rising rates, inflation, stretched affordability — yet the southern Gold Coast's medians have risen over the year. Those national forces reach every market; the question is what has offset them here. The answer is not in the price figures at all, but in who is moving, where the work is, and what the same money buys.
Who is moving
Queensland recorded a net interstate migration gain of 21,595 people in 2024–25 — the largest of any state — with the biggest inflows from New South Wales (+13,020) and Victoria (+6,920) (Queensland Government Statistician's Office, from ABS). Queensland has recorded a net interstate migration gain in every quarter since June 1981, the only state to do so.
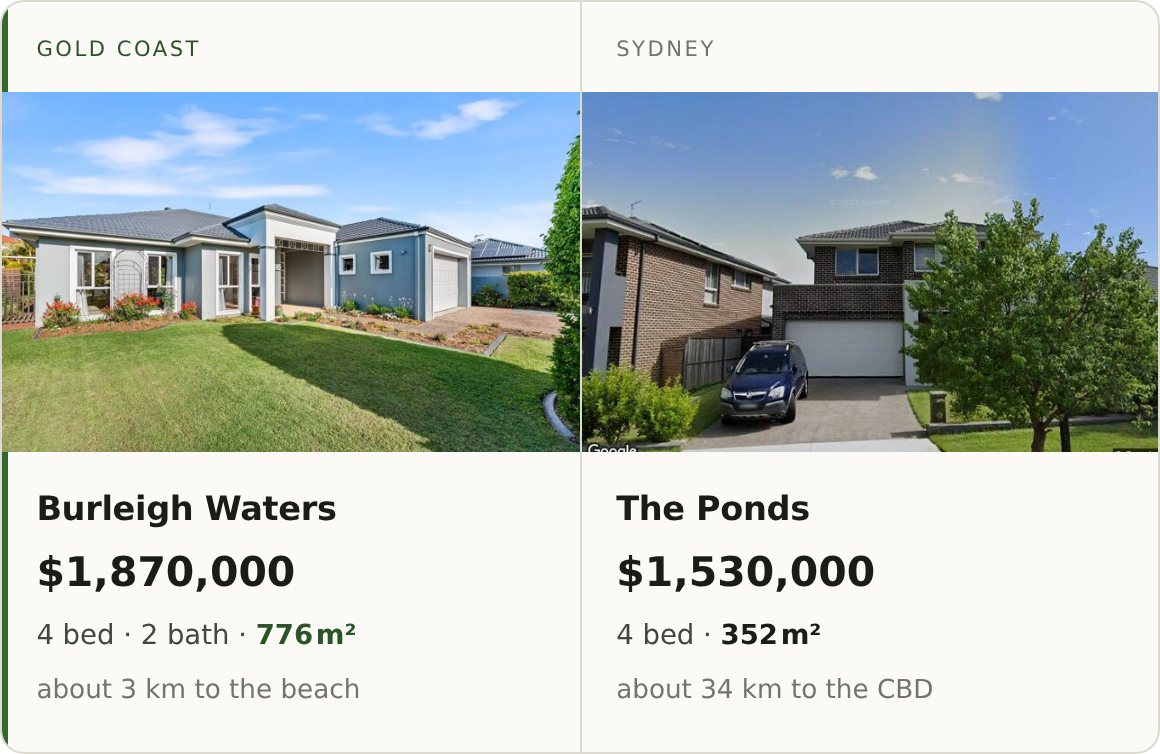
Why move north? Because the same money reaches more here. A median Burleigh Waters house sits around $1,865,000 on a 622 m² block, roughly 3 km from the beach. In Sydney, less than that — about $1,530,000 — reaches only the outer fringe: in The Ponds, around 34 km from the CBD, that buys about 352 m² (public sold records). The blocks are the fact; the beach and the commute are the context. The affordability gap sits underneath it: a median-income Sydney household needs about 16.7 years to save a 20% deposit, against 12.9 years in Brisbane (Cotality, September 2025).
Two real homes: a 776 m² block on the Gold Coast against a 352 m² block in Sydney. Photos: Gold Coast from listing records; Sydney Street View, Google. Sold-price facts from Our records and public sold records.
Where the work is
Labour demand is strongest here on a per-person basis. For every 1,000 people employed, Queensland has about 23 job vacancies open, against 21 in New South Wales and 20 in Victoria (ABS Job Vacancies, cat. 6354.0, 2026 Q2). Queensland's unemployment, around 4.1% over the three months to July 2026, is the lowest of the three — below New South Wales (4.2%) and Victoria (5.0%) — and the state added about 56,000 jobs over the year to July 2026 (ABS Labour Force, cat. 6202.0).
So strong underlying demand is holding the Gold Coast market up and making it more resilient than Sydney or Melbourne. What we look for next are stronger leading indicators of price moves — the metrics that often signal a turn in advance.
4. Is the Gold Coast market about to fall?
No one can tell you for a fact what the market will be worth next year, and anyone who names a figure is selling you a guess. But unknowable is not the same as unreadable. A market leaves a trail before it moves, and one of the best ways to read where it is heading is to watch the signals that turn first — not price, which you have already seen arrives late.
So we did the work. Across our analysis of 27 economic series over eight Gold Coast suburbs, 2015–2025, we separated the indicators that lead Gold Coast prices from the ones that only confirm them — and the answer runs against what most people watch. The number on every front page, interest rates, is a lagging one: rates follow Gold Coast prices by about a year (they lag, at r = 0.79). What leads, in that data, is money in people's pockets: household spending is the single strongest gauge of market strength here (r = 0.91); Queensland wage growth has run three to four months ahead of house prices; retail spending, a proxy for confidence, has led by four to five months. A 1% rise in real household income has, over the period, moved Gold Coast prices about 1.7%.
So the question worth asking is not where prices go next, but what those leading indicators are doing now. Two can be read straight from the Bureau of Statistics for Queensland:
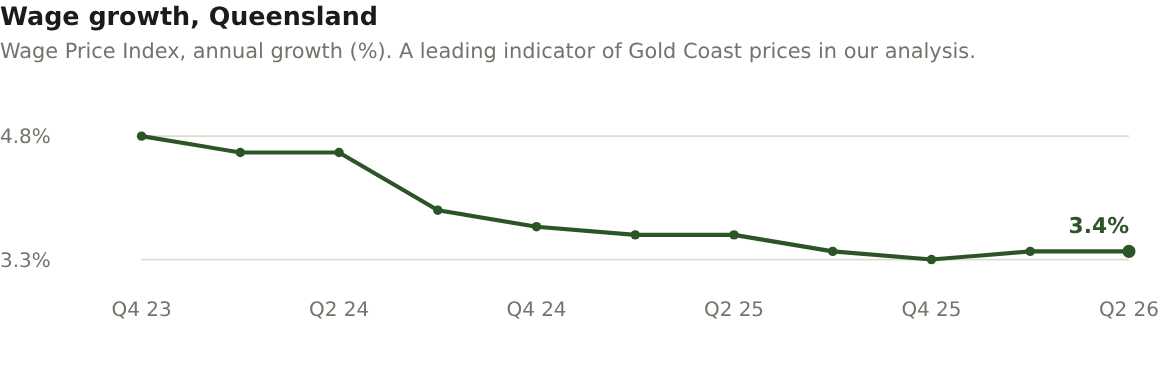
Wage growth — the indicator with the longest lead in our analysis — has eased over the past two years, from about 4.8% to about 3.4% a year (ABS Wage Price Index, 2026 Q2). Still positive, but no longer accelerating.
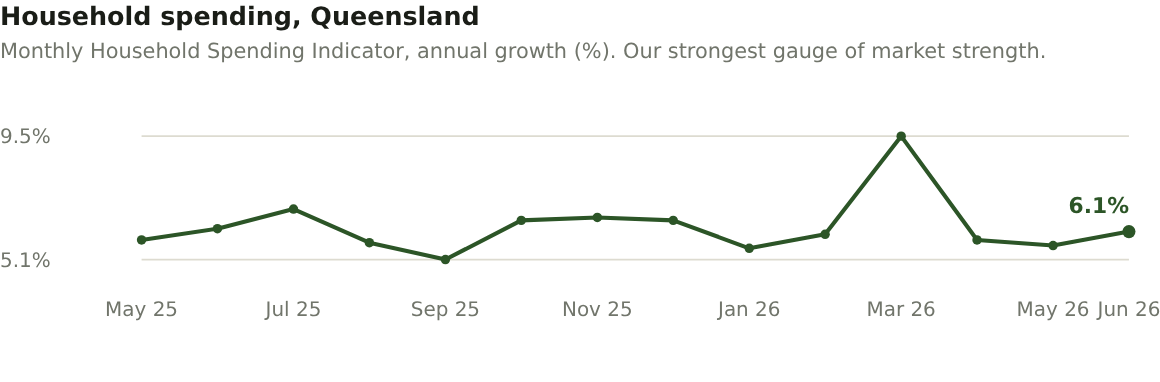
Household spending — the strongest gauge of market strength — has held broadly steady, running about 6.1% a year (ABS Monthly Household Spending Indicator, June 2026). Where pay growth has eased, the till has not.
Figure Three — Annual growth, each period against a year earlier. Source: ABS Wage Price Index.Figure Four — Annual growth, each period against a year earlier. Source: ABS Monthly Household Spending Indicator.
Set the two against each other — pay growth easing, spending holding — and beside the roughly 23 job vacancies per thousand workers and the migration north from the last section, and you have the forward part of the picture in one place.
The honest characterisation of the evidence is continued, if unhurried, growth: medians up, homes still selling briskly, the momentum signals steady for now. That is what the data says today, not a promise about next year. Were the signals that lead prices to roll over, this reading would move with them.
So here are the four dials worth watching from here:
Wage growth — it has already slowed
The oil price that drove the recent inflation
Household spending
Time on market
If wage growth keeps falling and household spending turns down with it, that is the combination that has — in our data — preceded softer prices three to four months on. A days-on-market figure that keeps climbing would be the earliest confirmation. None of that has happened yet. These are simply the dials worth watching.
Each suburb median rests on the sales behind it — 112, 58 and 42 — which is a sample of each suburb's activity, not all of it. A rolling 12-month median is smooth by design: neighbouring readings share most of their sales, so the line moves slowly and a single quarter cannot swing it. The lead-and-lag relationships above are measured in past data, not forecasts — a relationship observed before may not hold again. And a suburb median cannot tell you what a specific house is worth; the value of any one home turns on its own block, condition and position, weighed against the sales nearest it.
Keep reading:Gold Coast market data — prices, supply and selling times, updated as new sales settle.
Licensed Queensland real estate agent, founder of Fields Real Estate and Lead Analyst at Fields Research. Covering Gold Coast market data, comparable sales analysis and suburb intelligence.
Where does your own home sit?
Fields keeps a record of every active listing and recent sale across the southern Gold Coast, and reads any address against the sales around it — the comparables, the range they support, and the method behind it. This analysis of the Gold Coast comes from the same database.