What do comparable sales say about your home?Your home vs recent sales
Enter your address to see the comparable sales around it. Free, no sign-up.Free comparable sales for your address.
🔍
Analyst21 August 2026·Updated 15 September 2026·7 min read
Is the Gold Coast market about to fall?
National values are falling and Brisbane has turned — but a slowing market and a falling one are different things. What separates them, and where the Gold Coast actually sits.
Working titles: “Is the Gold Coast market about to fall?” / “What a falling market actually looks like”. \~1,200 words. Charts marked inline.
It is the question Gold Coast homeowners are asking most often right now, and more loudly than in years.
The reasons are not imaginary. Nationally, Cotality’s Home Value Index fell 0.7% in July — the largest single monthly decline since December 2022. Brisbane, which spent five years as one of the country’s strongest markets, fell 0.6% over the month and 0.6% over the quarter, its second consecutive monthly decline. And on 11 August the Reserve Bank said so itself, in the plainest language a central bank uses:
“Momentum in the housing market has shifted, with housing prices falling in some capital cities and new housing loans declining noticeably.”
So the question is fair. What follows is what our data can tell you, what it cannot, and the difference between a market that is slowing and a market that is falling apart.
First: what a crash actually requires
Prices fall in two quite different ways, and conflating them is where most of the anxiety comes from.
The first is a market where fewer buyers can pay what sellers want. Homes take longer to sell, some do not sell at all, and achieved prices drift. This is uncomfortable, and it is what most people mean when they say the market is “down”.
The second is a market where owners are compelled to sell regardless of price. That requires a mechanism — most often widespread job losses, or borrowers unable to service debt at any price they can achieve. Forced selling is what turns a soft market into a falling one, because it removes the seller’s ability to simply wait.
That distinction matters because the two are measured by different indicators, and they are currently pointing in different directions.
The indicator worth watching
If forced selling is the mechanism, the labour market is where it would show up first — and it moved this month.
Figures released on 20 August put national unemployment at 4.5% in July, up from 4.4% in June. Employment fell by 15,800 over the month, the participation rate slipped, and the number of people unemployed is 7.0% higher than a year ago.
Those are small movements from a low base. An unemployment rate of 4.5% is historically low, and 691,500 people unemployed against 14.8 million employed does not describe a workforce in trouble. Australia has sustained house prices through considerably worse.
But the direction changed. Through 2025 this indicator was improving; it is now drifting the other way, and the Reserve Bank noted on 11 August that labour market conditions had “eased by a little more than expected in recent months”. If you want one number to watch over the next two quarters, this is it — not the median price.
What the rest of the national picture shows
The cash rate has been at 4.35% since June, after three increases this year in February, March and May. The Reserve Bank held again on 11 August, unanimously, and kept an explicit tightening bias: it would consider “increasing the cash rate target further if upside risks materialise”. It does not expect inflation back to the middle of its target band until late 2027.
Borrowing capacity has tightened accordingly, and the Wage Price Index rose 3.2% over the year against inflation of 3.8% — meaning real wages went backwards.
Those are constraints on demand, not signs of distress among owners. It is a meaningful distinction: a market where buyers can pay less is a slower market, while a market where owners must sell is a falling one.
What is happening here
Across Robina, Varsity Lakes and Burleigh Waters, the indicators that usually precede forced selling are not present.
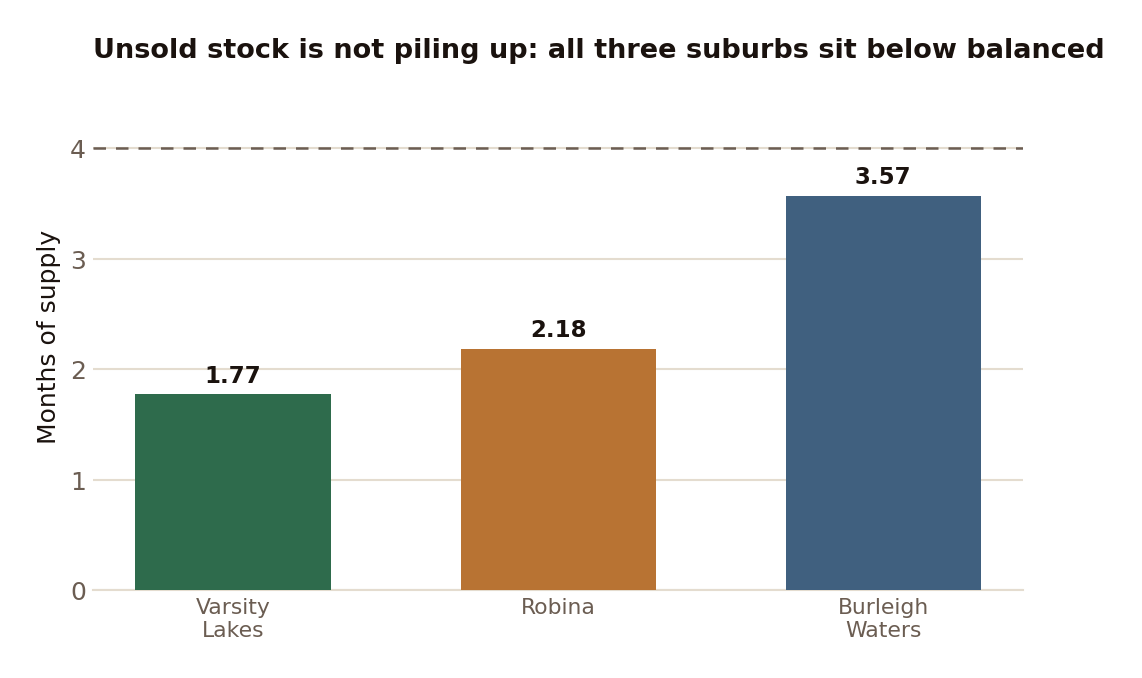
Unsold stock is not accumulating. Months of supply — how long it would take to clear everything currently listed at the current rate of sale — sits at 1.77 months in Varsity Lakes, 2.18 in Robina and 3.57 in Burleigh Waters. Four months is generally treated as balanced. Rising unsold inventory is one of the earliest crash indicators, and in two of the three suburbs supply is tighter than balanced.
Homes are also still transacting close to asking. On settlement data, Varsity Lakes homes sold 2.1% above asking on average, Robina 0.4% above, and Burleigh Waters 0.6% below. Those are small numbers in every direction — which is the point.
Months of supply by suburb. Four months is generally treated as balanced; all three sit below it, so unsold stock is not accumulating — the overhang that turns a soft market into a falling one is absent.
But the three suburbs are not moving together
This is the part that gets lost when the market is discussed as a single thing.
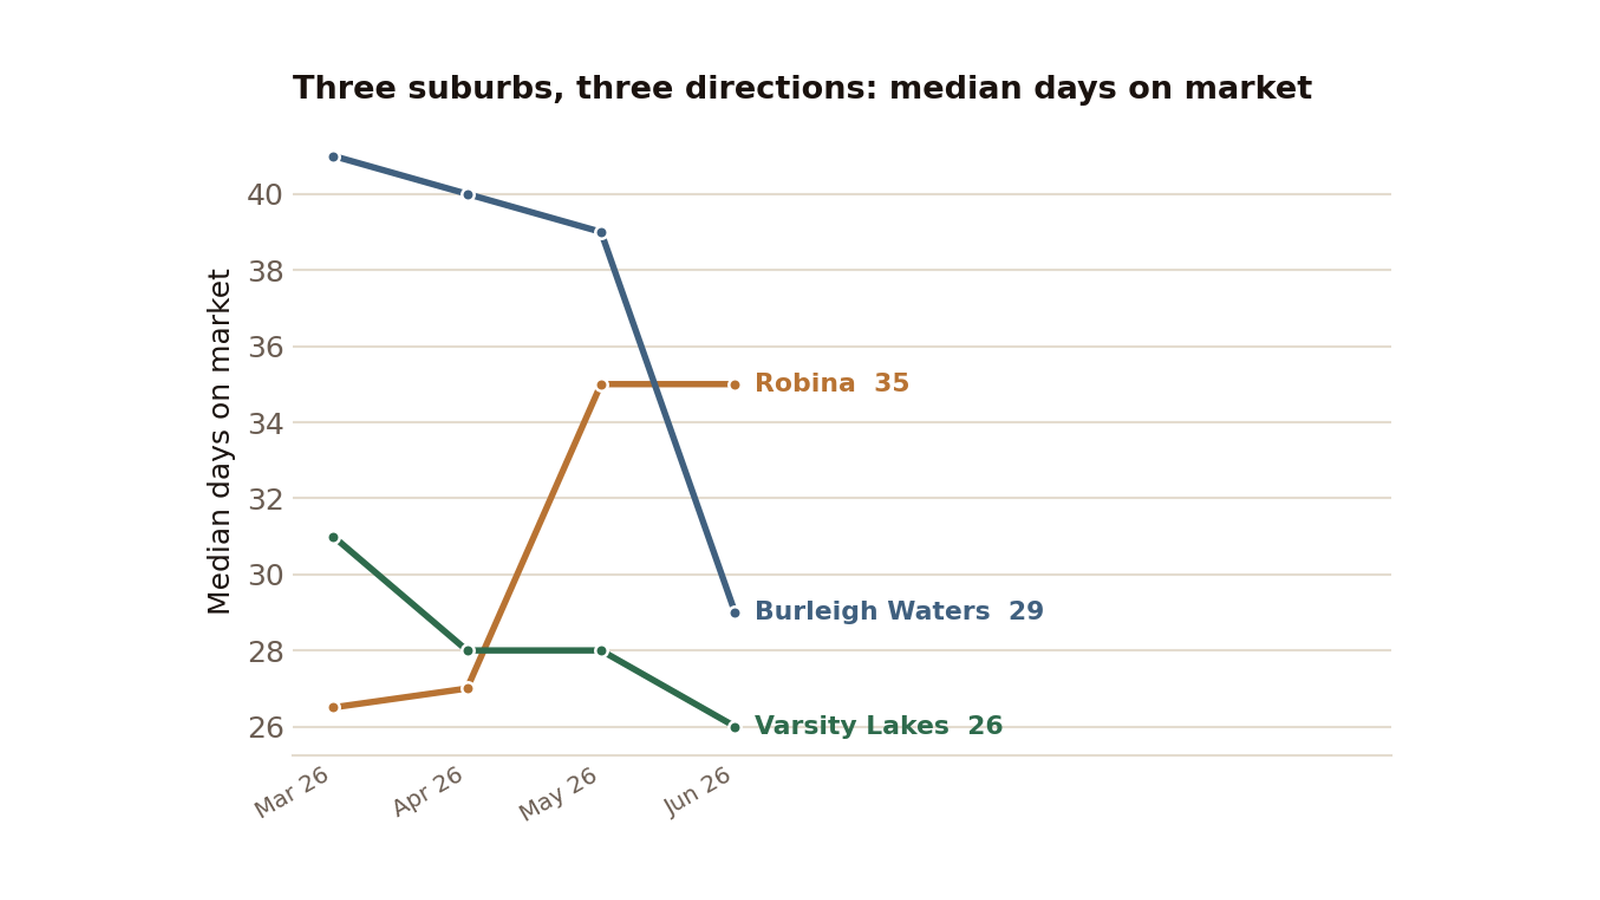
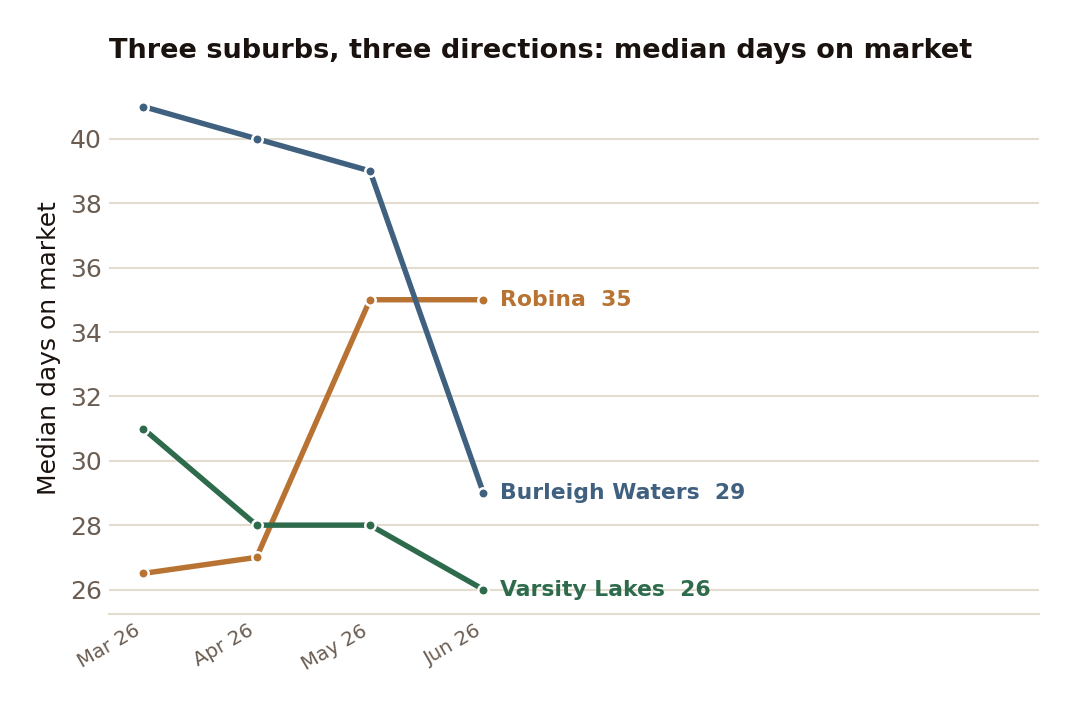
In Robina, homes are taking meaningfully longer to sell. The median time on market reached 34 days in the June quarter, up 9.5 days on a year earlier. The share of homes selling within a month fell from 74.1% to 45.7% — from roughly three in four, to fewer than half.
In Burleigh Waters, six kilometres away, the opposite happened. The median time on market shortened to 29 days, eight days faster than a year earlier. The share selling within a month rose to 51.3%, and the share taking longer than 90 days fell to 5.1%.
Both movements are corroborated by PropRadar, an independent data source using a different collection method. In Varsity Lakes, the median sits at 26 days, five days slower than a year ago but still the fastest of the three.
Median days on market, three-month rolling. Robina has lengthened while Burleigh Waters has eased and Varsity Lakes held — one region, three directions.
Notably, prices in all three suburbs moved far less than the time it took to achieve them. Over the twelve months to August, house medians were $1,490,000 in Robina (up 5.8%), $1,400,000 in Varsity Lakes (up 10.2%) and $1,925,000 in Burleigh Waters (up 6.9%).
Time on market moves before price does. If you want an early read on whether a market is turning, it is the more informative number — and right now it says two of our three suburbs got faster or held, and one got slower.
What we cannot tell you
We do not publish price forecasts, and this month is a good illustration of why.
On 10 July, Westpac was forecasting two further rate rises to 4.85%, and 55% of economists surveyed by Finder expected at least one more increase during 2026. On 29 July, June-quarter inflation came in softer than expected. On 30 July, Westpac withdrew the forecast entirely. Within three weeks, the most hawkish major bank in the country had reversed. All four majors now expect the next move to be a cut, and not before 2027.
The honest position is that nobody knows — including the people paid to know. What is worth doing instead is separating the numbers solid enough to lean on from the ones that are not.
On that: no quarter-on-quarter price change is quoted for Robina or Burleigh Waters here — the sales counts in those quarters are too small for the move to be told apart from noise. Robina’s June quarter shows an apparent fall of nearly ten per cent; it sits inside the margin of error, so it is not a figure to publish.
Where that leaves things
Two things are true at once, and they run on different clocks.
The longer-term case for South East Queensland — population growth, the infrastructure program, the 2032 Games, a construction pipeline that has not kept pace — is intact, and most of what is published about this region is written in that timeframe.
The shorter-term picture is that national values are falling, Brisbane has turned, borrowing capacity is constrained, the labour market has begun to soften, and one of our three suburbs is taking a third longer to sell a home than it was a year ago.
Both are true. Which one matters to you depends entirely on when you were planning to move. Sources: Cotality Home Value Index, July 2026 · Reserve Bank of Australia media release 2026-19, 11 August 2026 · ABS Labour Force Australia, July 2026, released 20 August 2026 · ABS Wage Price Index and Consumer Price Index · PropRadar · Fields Estate transaction data, Robina, Varsity Lakes and Burleigh Waters, twelve months to 2 August 2026. Suburb medians are computed compiled from public sale records; sample sizes and confidence intervals are published on each suburb’s Market Intelligence page.
Keep reading:Gold Coast market data — prices, supply and selling times, updated as new sales settle.
Licensed Queensland real estate agent, founder of Fields Real Estate and Lead Analyst at Fields Research. Covering Gold Coast market data, comparable sales analysis and suburb intelligence.
Where does your own home sit?
Fields keeps a record of every active listing and recent sale across the southern Gold Coast, and reads any address against the sales around it — the comparables, the range they support, and the method behind it. This analysis of the Gold Coast comes from the same database.