What do comparable sales say about your home?Your home vs recent sales
Enter your address to see the comparable sales around it. Free, no sign-up.Free comparable sales for your address.
🔍
Analyst4 October 2026·Updated 4 October 2026·8 min read
Should I Sell Now or Wait? What the Gold Coast Data Can and Cannot Answer
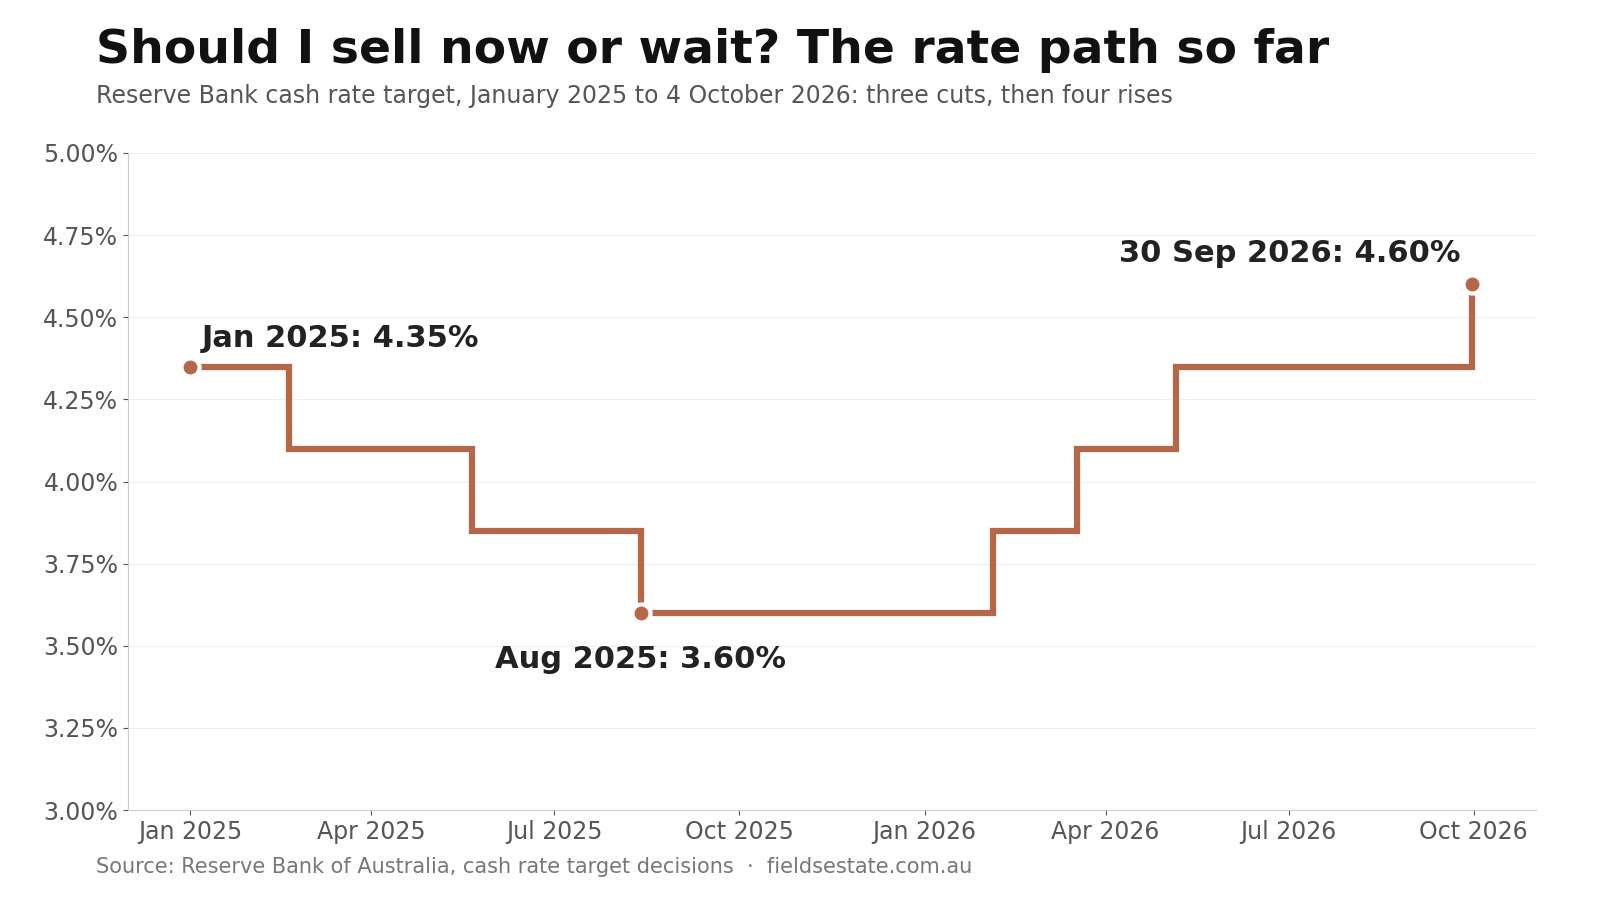
No data set can tell a particular household whether to sell now or wait. What it can show: the cash rate went from 4.35% down to 3.60% and up to 4.60% in twenty-one months, a general price move lands on both sides of a sell-and-buy trade, and Gold Coast homes unsold after 60 to 180 days rose from 1,288 to 2,618 between March and August.
"Should I sell now or wait?" is the question I am asked most at the moment. It is also one of the most common property questions people type into search, sometimes with a year attached: "should I sell my house now or wait until 2027".
No data set can answer that for a particular household, and ours is no exception. What the data can do is show what waiting has actually involved over the past two years, and which facts about an owner's own situation carry the most weight. That is what this piece sets out. The conclusion belongs to you.
One date stamp first. On Tuesday 29 September 2026 the Reserve Bank raised the cash rate by 0.25 percentage points to 4.60%, its fourth rise this year. Its next decision is due on 3 November 2026.
1. The rate cut many owners are waiting for has moved more than once
The most common reason owners give me for waiting is interest rates: the hope that cheaper borrowing brings more buyers, and more buyers bring better prices. Here is what that wait has looked like.
Reserve Bank cash rate
Rate
Start of 2025
4.35%
After the February 2025 cut
4.10%
After the May 2025 cut
3.85%
After the August 2025 cut
3.60%
After the February 2026 rise
3.85%
After the March 2026 rise
4.10%
After the May 2026 rise (held in June and August)
4.35%
After the September 2026 rise
4.60%
Source: Reserve Bank of Australia, cash rate target decisions, January 2025 to September 2026.
4.60%
The cash rate from 30 September 2026. It started 2025 at 4.35%, fell three times to 3.60%, then rose four times to finish above where it started.
The published views of bank economists moved too. Around 8 September, Westpac's economists made a November rise their base case. By 21 September, all four major banks expected a rise at the 29 September meeting, and one came, earlier than the November rise Westpac's economists had made their base case three weeks before. Those calls are dated views of their authors, and the record above shows how often views like them changed this year.
I don't put that forward to argue for or against waiting. It is simply what the rate half of the waiting plan has looked like, measured, over the past twenty-one months.
2. Selling and buying are two sides of one trade
An owner who is selling is often also buying their next home. For them, a general move in prices lands on both sides of the trade at once. The arithmetic below uses a uniform 5% move in either direction purely as an illustration. It is not a view on which way prices go.
Illustration
Today
All prices −5%
All prices +5%
Moving up: sale price
$1,400,000
$1,330,000
$1,470,000
Moving up: purchase price
$1,700,000
$1,615,000
$1,785,000
Gap to fund
$300,000
$285,000
$315,000
Moving down: sale price
$1,700,000
$1,615,000
$1,785,000
Moving down: purchase price
$1,100,000
$1,045,000
$1,155,000
Cash released
$600,000
$570,000
$630,000
Illustrative arithmetic only, before selling and buying costs. Not based on any particular property.
For an owner moving up, a market-wide fall narrows the dollar gap and a market-wide rise widens it. For an owner moving down, it works the other way. For a like-for-like move, sideways in price, the two sides roughly cancel. In conversation, owners tend to focus on the sale price alone, which is only half of the calculation.
Three things keep the real world messier than the table. Prices do not move uniformly: different price points and postcodes move at different speeds, as the listing counts in section 3 show. The order of the two transactions matters, because an owner who sells first and buys later, or the reverse, carries the movement in between. And agent's fees and transfer duty are paid whenever the move happens.
3. What differs from one owner to the next
The same market can be a very different decision for two neighbours. These are the facts that tend to separate them.
Whether you are also buying, and at what price point. Covered above. An owner who is selling to rent, or to leave the area, is exposed to one side of the trade, not two.
What holding costs each month. Mortgage interest, council rates, insurance and upkeep continue while an owner waits. Rate moves change the first of these in a way that is easy to calculate. Each 0.25 percentage point on a $600,000 variable loan is about $1,500 a year in interest. The four rises since February 2026 add up to 1.00 percentage point, or about $6,000 a year on that loan if passed on in full.
The reason for moving and the timeframe. Many owners sell because of a life event: a growing family, a separation, retirement, a new job, an estate. Those timelines are set by life, not by the cash rate, and the data above applies to them differently from how it applies to an owner who is moving by choice.
What the home is competing against right now. This is where the local data is clearest. Across the Gold Coast, homes listed for 60 to 180 days without selling rose from 1,288 in March 2026 to 2,618 in August 2026. The median house that sold in the three months to August had been on the market for 40 days, up from 26 days in the three months to March. By postcode, total listings from March to August rose 42% in 4226 (Robina and surrounds) and 46% in 4227 (Varsity Lakes and Reedy Creek), and 4% in 4220 (Burleigh Waters, Burleigh Heads and Miami). I go through those indicators in detail in Unsold Gold Coast homes have doubled since March.
Longer selling times are a cost in their own right, since each extra week on the market is another week of holding costs. And a home's position against the other homes for sale at the same price, in the same postcode, is specific to that home.
What the data cannot answer, and what it can
It cannot say which way prices go from here. Nationally, Cotality's index was 3.6% below its March 2026 peak at the end of August, and Brisbane's was 2.7% below its May peak. Our twelve-month medians for Robina, Varsity Lakes and Burleigh Waters are still above where they were a year earlier. Both are accurate, they measure different moments, and neither settles the next twelve months. It cannot say when rates change, and the record in section 1 shows how often professional views on that changed this year.
What it can show is the part of the question that is about your home specifically: how many similar homes are for sale around it, how long they are taking, what comparable homes have recently sold for, and what the numbers look like on both sides of the move you have in mind. That is the half of the decision that data can actually inform.
I walk through the Gold Coast market, including the stock and selling-time readings above, on the Gold Coast market page. If you would like to see how your own home sits against recent sales and current competition on your street, enter your address here.
Notes and sources. Cash rate: Reserve Bank of Australia, cash rate target decisions, 2025 to September 2026; the 29 September 2026 rise to 4.60% took effect on 30 September; next meeting 2 to 3 November 2026 (RBA Monetary Policy Board schedule). Bank economists' views: The Adviser, 8 to 9 September 2026 (Westpac's move to a November rise); investingLive, 21 September 2026 (all four major banks expecting a rise to 4.60% on 29 September). These are reported as dated views of their authors, not as Fields' views. Interest arithmetic: simple annual interest on a $600,000 balance, ignoring repayments and lender margin changes; actual changes depend on each lender and loan. Two-sides illustration: hypothetical prices and a uniform 5% move, before costs; not a projection. Listings by time on market and by postcode: SQM Research total property listings, all dwelling types, monthly counts to August 2026; "Gold Coast" is the sum of 22 Gold Coast postcodes; postcode areas are wider than the suburbs named. Selling times: Fields sold-property records, median days from advertised date to sold date, trailing three months, agent-listed houses pooled across a panel of 63 Gold Coast suburbs (759 house sales in the three months to August 2026); sales advertised for three days or fewer excluded; not comparable with other providers' figures. National and Brisbane values: Cotality Home Value Index, September 2026 release, data to 31 August 2026. Suburb twelve-month medians: Fields market charts at fieldsestate.com.au/market-intelligence. Search question wording: Fields search-intent monitoring, 14 days to 22 September 2026; it includes queries from outside the Gold Coast. This article reports data and does not constitute advice.
Licensed Queensland real estate agent, founder of Fields Real Estate and Lead Analyst at Fields Research. Covering Gold Coast market data, comparable sales analysis and suburb intelligence.
Where does your own home sit?
Fields keeps a record of every active listing and recent sale across the southern Gold Coast, and reads any address against the sales around it — the comparables, the range they support, and the method behind it. This analysis of the Gold Coast comes from the same database.