What do comparable sales say about your home?Your home vs recent sales
Enter your address to see the comparable sales around it. Free, no sign-up.Free comparable sales for your address.
🔍
Analyst28 September 2026·Updated 28 September 2026·7 min read
Unsold Gold Coast Homes Have Doubled Since March: The Indicators That Move Before Prices Do
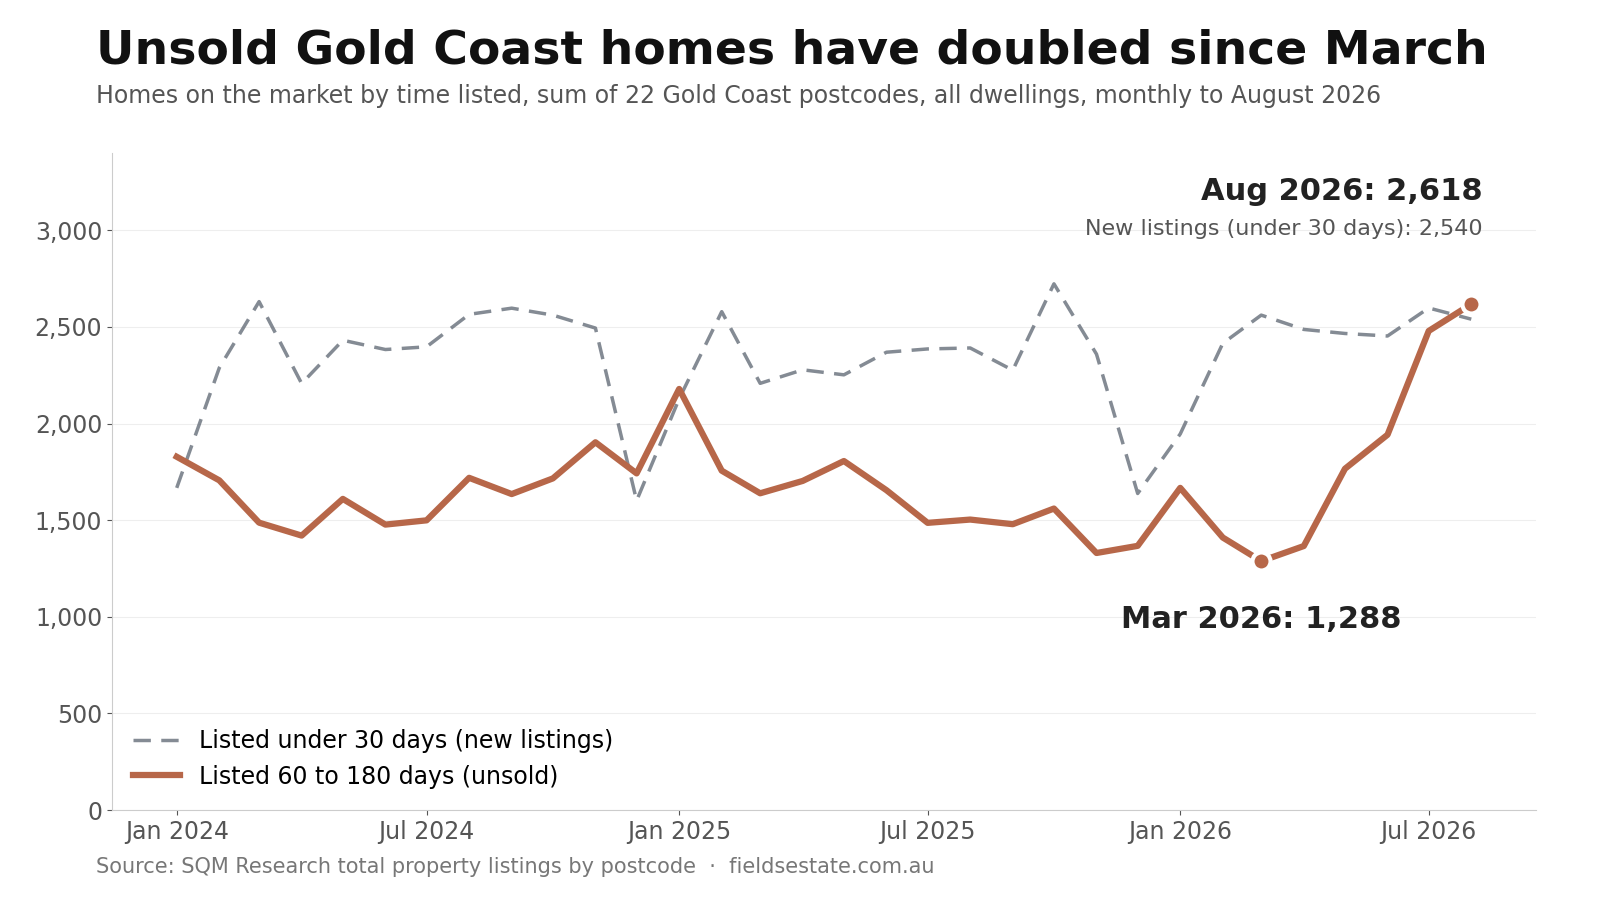
Gold Coast homes listed for 60 to 180 days rose from 1,288 in March to 2,618 in August, while new listings stayed flat. What unsold stock, selling times and home lending are reading now, and what they did the last time they moved together.
In March, 1,288 homes across the Gold Coast had been listed for between 60 and 180 days without selling. In August it was 2,618. The number of homes sitting on the market for two to six months has doubled in five months.
Median prices have not shown this yet. The rolling twelve-month medians for Robina, Varsity Lakes and Burleigh Waters are all still above where they were a year ago. That is the gap many owners are describing to me right now: the national headlines say the market has turned, and nothing about their own street confirms it.
Both things can be true at once, because they measure different moments. A median sale price describes homes that have already sold, and a twelve-month median includes sales from well before this winter. The measures below describe what is happening to homes that are for sale now. Historically, they are the numbers that have moved first.
2×
Gold Coast homes listed 60 to 180 days: 1,288 in March 2026, 2,618 in August 2026. A year earlier, in August 2025, the figure was 1,503.
1. Unsold stock: the rise is homes not selling, not a rush of new sellers
The detail that matters most is which listings grew. Homes listed for less than 30 days, which is a rough measure of new sellers arriving, barely moved: 2,561 in March and 2,540 in August. The growth came almost entirely from homes that had been on the market longer.
Gold Coast listings, by time on market
Mar 2026
Aug 2026
Change
Under 30 days (new listings)
2,561
2,540
−1%
60 to 180 days
1,288
2,618
+103%
More than 180 days
870
961
+10%
All listings
5,823
7,715
+32%
Source: SQM Research total property listings by postcode, all dwelling types, summed across 22 Gold Coast postcodes; monthly counts to August 2026. The 30–60 day band is included in the total but not shown as its own row.
Roughly the same number of homes are coming to market each month as in autumn. What changed is how many of them are still there two, three and four months later.
The context matters too. The 2,618 figure is a doubling from a very low base. March 2026's 1,288 was the lowest monthly reading in the series, which starts in 2010. In every August from 2010 to 2019, more than 3,200 Gold Coast homes sat in the 60-to-180-day band. Today's level is high for the past five years and still below what was normal for the decade before them.
2. Selling times: houses now take 40 days, up from 26
The same shift shows up in how long sold homes took to sell. Across our Gold Coast suburb panel, the median house that sold in the three months to March 2026 had been on the market for 26 days. For the three months to August 2026, it was 40 days, across 759 house sales. For units the median rose from 25 days to 36.
Selling time and unsold stock are connected. If the same number of homes arrive each month but each one takes longer to sell, more of them are on the market at any one time. If selling times remain around 40 days through spring, the arithmetic means stock would keep building even with no increase in new sellers.
3. Home lending: still growing, but at half the pace
The third indicator is demand from borrowers. New housing lending in Queensland was 10.0% higher in the June quarter of 2026 than a year earlier. That is still growth. But in the December quarter of 2025 the same measure was running at 20.2%, so the pace has roughly halved in six months.
We track this because, on our Gold Coast composite, the growth rate of Queensland lending has tended to lead the growth rate of Gold Coast prices by about a year. Over 2018 to 2025, lending growth four quarters earlier tracked annual price growth with a correlation of 0.78. That is a strong historical relationship, not a law. It describes what has tended to happen, and it does not tell us what will.
What these indicators did the last time they moved together
The closest recent comparison is 2022. Between March and August 2022, Gold Coast listings in the 60-to-180-day band rose from 1,442 to 2,236, an increase of 55%. Over the following year, annual growth in our Gold Coast composite price measure slowed from 34.6% (March quarter 2022) to 3.3% (June quarter 2023).
Two cautions apply. First, 2022 was also the year the Reserve Bank began raising the cash rate from 0.10%, so the stock build-up and the slowdown shared a cause and cannot be separated. Second, prices slowed but annual growth stayed positive on this measure. A rise in unsold stock has preceded slower price growth before. On this series, it has not reliably preceded falling prices.
What it looks like in Robina, Varsity Lakes and Burleigh Waters
The same SQM Research counts are available for the three postcodes we cover in most depth. These are total listings of all ages, so they are a broader measure than the 60-to-180-day band above.
Total listings, by postcode
Mar 2026
Aug 2026
Change
4226 (Robina, Clear Island Waters, Merrimac)
200
284
+42%
4227 (Varsity Lakes, Reedy Creek)
116
169
+46%
4220 (Burleigh Waters, Burleigh Heads, Miami)
312
324
+4%
Source: SQM Research total property listings, all dwelling types, by postcode. Postcode areas are wider than the suburbs they are named after.
Robina and Varsity Lakes have followed the Gold Coast pattern closely. The Burleigh postcode has barely moved. That is a real difference between neighbouring areas, and it is why a single Gold Coast figure can describe one street accurately and the next one poorly.
What these numbers can and cannot tell you
None of these indicators says what any individual home is worth, and none of them settles where prices go from here. They describe conditions: how many homes are competing for buyers, how long buyers are taking, and how quickly credit is growing. A seller in a market with more stock and longer selling times is in a different position from one in a market where homes sell in three weeks, whatever the twelve-month median says.
I update these indicators each month as the data arrives, and I explain what changed when they move.
If you want to see these charts in motion, I walk through the Gold Coast market, including the stock and selling-time readings above, on the Gold Coast market page. If you would like to see how your own home sits against recent sales on your street, enter your address here.
Notes and sources. Listings by time on market and by postcode: SQM Research total property listings, all dwelling types, monthly counts to August 2026; "Gold Coast" is the sum of 22 Gold Coast postcodes; historical comparisons use the same series back to January 2010. Selling times: Fields sold-property records, median days from advertised date to sold date, trailing three months, agent-listed sales, pooled across a panel of 63 Gold Coast suburbs; sales advertised for three days or fewer are excluded; houses and units counted separately; not comparable with figures from other providers, whose definitions differ. Lending: Australian Bureau of Statistics, Lending Indicators, new housing loan commitments for Queensland, year-on-year change, quarterly, to the June quarter 2026. Price growth and the lending correlation: Fields Gold Coast composite, a transaction-weighted combination of rolling twelve-month median sale prices across 63 Gold Coast suburbs, annual change, 2018 to 2025; correlation measured at a four-quarter lead. Suburb twelve-month medians: Fields market charts at fieldsestate.com.au/market-intelligence. Past relationships are reported as history only. This article reports data and does not constitute advice.
Licensed Queensland real estate agent, founder of Fields Real Estate and Lead Analyst at Fields Research. Covering Gold Coast market data, comparable sales analysis and suburb intelligence.
Where does your own home sit?
Fields keeps a record of every active listing and recent sale across the southern Gold Coast, and reads any address against the sales around it — the comparables, the range they support, and the method behind it. This analysis of the Gold Coast comes from the same database.