Analyst22 September 2026·Updated 22 September 2026·14 min read
The Coomera Connector: What the Modelling Says About M1 Traffic, and What Motorways Have Done to House Prices
It isn't the M1 upgrade — it's a second motorway, and a quarter of Stage 1 is open. What the government's modelling says it will do to peak-hour drive times and M1 traffic, what research on other new motorways found about house prices, and what homes along the Coomera-to-Nerang corridor have sold for.
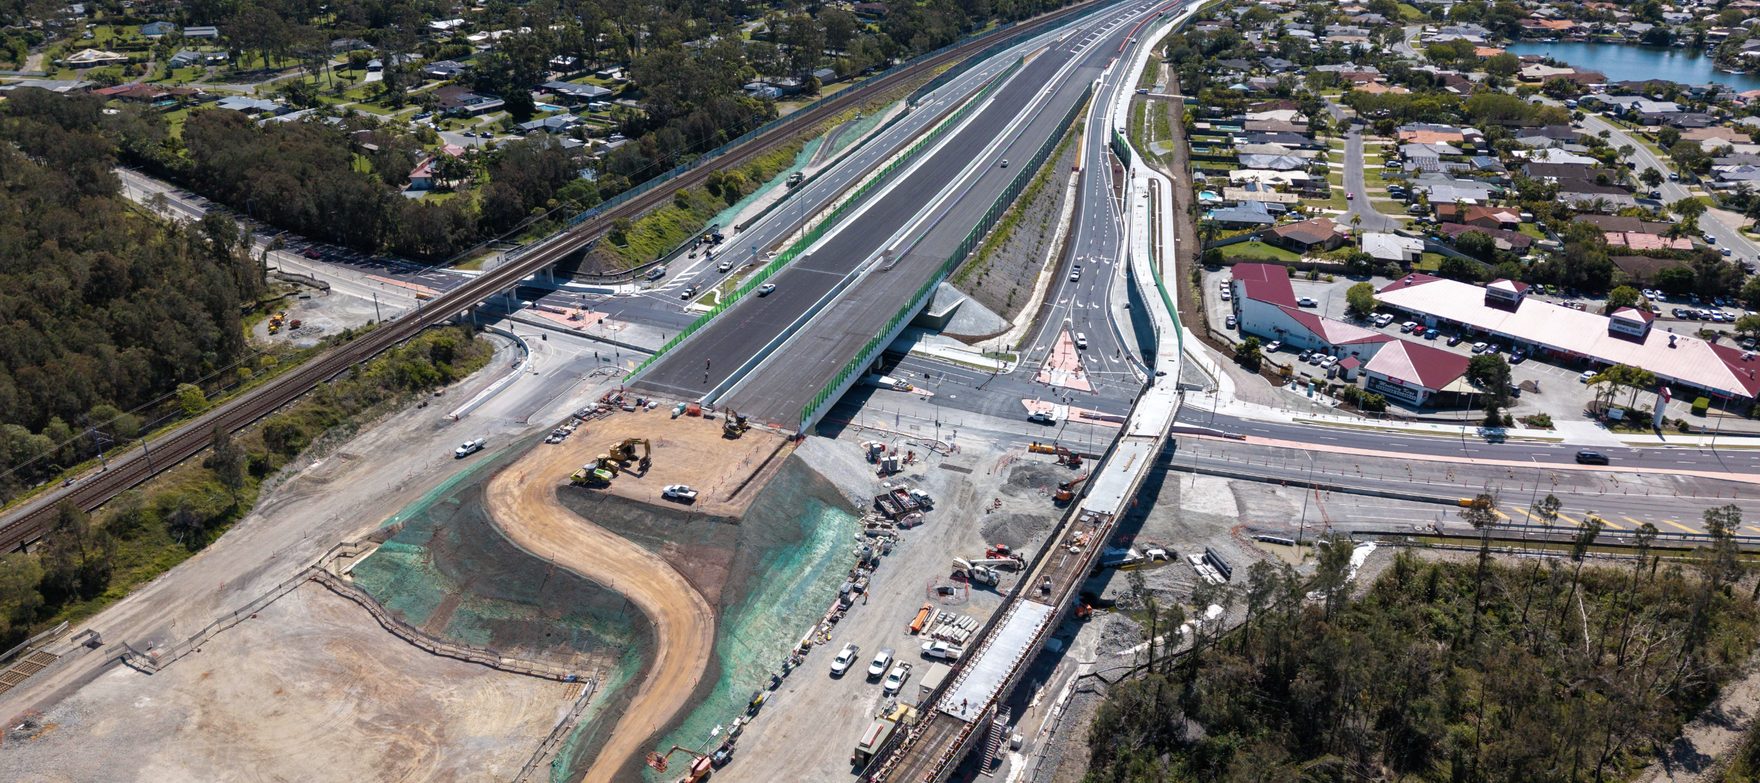
If you have driven between Coomera and Nerang this year, you have driven past a $3.5 billion road project. Most people call it "the M1 upgrade". It isn't — it is a second motorway, built to pull local trips off the M1. A quarter of it is open.
Two different things are happening on the northern Gold Coast, and they are easy to confuse. One is the Coomera Connector: a brand-new road, built east of the M1 and running alongside it. The other is the long-running program of M1 Pacific Motorway upgrades: widening and interchange work on the motorway that already exists. This piece separates the two, sets out what is open and what is still being built, what the government expects the new road to do to peak-hour traffic, what research on other new motorways has found about house prices, and what homes along the route have actually been selling for.
What the Coomera Connector is
Stage 1 of the Coomera Connector — signposted as the M9 — is a new motorway of about 16 kilometres, running from Shipper Drive at Coomera to Nerang–Broadbeach Road at Nerang. It is the first piece of a planned 45-kilometre corridor from Loganholme to Nerang, sitting east of both the M1 and the rail line.
The Department of Transport and Main Roads (TMR) now lists Stage 1 at $3.5 billion, funded $1.75 billion by the Australian Government and $1.75 billion by the Queensland Government. That figure has moved: the business case evaluated by Infrastructure Australia in February 2022 costed it at $2.163 billion, and the joint ministerial statements at the December 2025 opening quoted $3.4 billion.
Along the way it adds interchanges at Helensvale Road, the Gold Coast Highway, the Smith Street Motorway and Southport–Nerang Road, new bridges over the Coomera and Nerang rivers, and a 16-kilometre shared path.
What is open, and what is still being built
Stage 1 is being delivered in three sections:
Section
Extent
Status (TMR, September 2026)
North
Shipper Drive to Helensvale Road — 4 km, 4 lanes
Open since December 2025
Central
Helensvale Road to the Smith Street Motorway — 8 km, 6 lanes
Under construction (main works began September 2024)
South
Smith Street Motorway to Nerang–Broadbeach Road — 4 km, 4 lanes
Under construction (main works began June 2025)
4 of 16 km
of Stage 1 is open to traffic today. TMR does not publish a completion date for the remaining 12 kilometres — its project page says only that the road is "progressively opening to traffic". The 2022 business case evaluation gave an indicative completion of 2026; that date is no longer on the government's project page.
What it is meant to do to peak-hour traffic
The case for the road starts with who is actually on the M1. TMR's business case found that 75% of vehicles that enter the M1 at Pimpama (Exit 49) and Coomera (Exit 54) leave it at or before Smith Street (Exit 66). Much of the traffic on the northern Gold Coast stretch of the M1 is local — people driving a few exits, not people driving to Brisbane or the border. The busiest section, between Exits 60 and 62, carries more than 210,000 vehicles on its busiest days.
The Connector gives those local trips somewhere else to go.
How much traffic it is expected to take off the M1
~10%
Forecast trips on the M1 fall from 195,000 to 175,000 a day with Stage 1 built, according to the business case evaluated by Infrastructure Australia. Stage 1 itself is forecast to carry up to 57,000 trips a day between Coomera and Nerang.
You will see a slightly different number quoted: TMR's business case summary says the Connector will carry up to 60,000 trips a day on its busiest part, between the Gold Coast Highway and the Smith Street Motorway, and ministerial statements describe it as removing "up to 60,000 local trips from the M1 per day". The 57,000 figure is Infrastructure Australia's for the whole Stage 1 route; the 60,000 figure is TMR's for the road's busiest section. Not every trip on the new road comes off the M1 — some are drawn from local roads, and some are new trips — which is why the modelled fall in M1 traffic (about 20,000 trips a day) is smaller than the traffic the Connector carries.
The longer-term picture is bigger. With the whole Loganholme-to-Nerang Connector built, TMR's modelling has more than 300,000 vehicles a day crossing the Coomera River by 2041 — about 192,000 on the M1 and more than 100,000 on the Connector. TMR expects traffic to settle at roughly 60–70% on the M1 and 30–40% on the Connector along its length. Only Stage 1 is funded for construction; the later stages are in design or planning.
What that means for drive times
The government's modelling is clearest about what happens without the road. TMR's business case projected these peak-period conditions:
Without the Connector
2016
2041 (forecast)
Coomera Town Centre to Southport
23 min
58 min
Nerang (Nielsens Road) to Coomera Town Centre
15 min
40 min
Average M1 speed, Coomera to Nerang (AM peak, northbound)
92 km/h
46 km/h
Average M1 speed, Coomera to Nerang (PM peak, southbound)
81 km/h
37 km/h
Source: TMR, Coomera Connector (Stage 1) business case summary. These are forecasts of a "do nothing" scenario, driven by the northern Gold Coast's population growing from 396,000 (2021) toward a projected 620,000 (2041).
What the road is expected to do about it is stated less precisely. In July 2024, as early works began on the South section, federal Infrastructure Minister Catherine King said the Connector would be "knocking 10 minutes off their journey between Coomera and Southport". TMR's own summary says that once the full Connector is complete, it will "allow the M1 to perform at (or near to) current levels of performance beyond 2041" — in other words, the aim is to hold peak-hour conditions roughly where they are while the population grows, not to return the M1 to an empty road. TMR also forecasts that by 2041 the number of residents who can reach their job within 30 minutes rises by 13% (from 186,700 to 210,700) with the road built.
Two caveats matter. These are government forecasts made before construction, not measurements. And with only 4 of 16 kilometres open — and that section ending at Helensvale Road — most of the travel-time benefit depends on the Central and South sections opening.
What comes after Stage 1
Stage 2 extends the road north, not south: about 5 kilometres from Shipper Drive to Yawalpah Road at Pimpama. It is in design, with planning funding only. The remaining section from Loganholme to Coomera has no construction funding. No stage south of Nerang is planned.
And what the M1 upgrade actually is
The M1 program is a separate list of projects on the existing motorway. On TMR's own program pages (updated August 2026), no M1 widening is currently under construction on the Gold Coast — which may be why so many people describe the works between Coomera and Nerang as "the M1 upgrade".
Completed: Varsity Lakes to Tugun (Exits 85–95) — 10 km widened to at least three lanes each way, $1.5 billion, finished in November 2025. Also completed: the Exit 49 Pimpama and Exit 41 Yatala South interchanges, and Eight Mile Plains to Daisy Hill.
In design: Exit 45 Ormeau North.
Planning only: Exit 54 Coomera, Exit 82 Robina, Exit 38 Yatala North, Daisy Hill to the Logan Motorway, Loganholme to Pimpama, and Logan Motorway to Nerang.
For anyone in Robina, Varsity Lakes or Burleigh Waters, the upgrade that touched your daily drive — Varsity Lakes to Tugun — is finished. The Robina interchange at Exit 82 is at planning stage.
What research says new motorways do to house prices
It is the question most people along the route ask. There is no study of the Coomera Connector itself — it is too new — but economists have measured what happened to house prices around other new motorways. Two peer-reviewed studies are close parallels, and they show why the answer is "it depends on where you are".
The Netherlands: two new highways, two opposite results. Levkovich, Rouwendal and van Marwijk (2016) tracked repeat sales of the same homes around two Dutch highways completed in 2004, comparing them with similar areas the roads did not touch. Across both roads combined, homes in the surrounding municipalities rose about 2.5–4.3% relative to the comparison areas, and by about 5% in the years before the roads were finished — the market moved on the expectation, not the opening. But the two roads behaved very differently:
Around the A50, which substantially improved how easily residents could reach jobs and services, homes gained about 9% in the four years before completion and 4.9–6.7% afterwards.
Around the A30, whose towns were already close to other motorways, the new road barely improved access — and prices there fell slightly relative to the comparison areas, by about 4% before completion.
Very close to the new roads, the downsides showed up: homes within 1 kilometre of a new interchange lost about 3% from extra traffic and about 3.6% from extra noise — although for most homes the access gain outweighed both.
Norway: a new road parallel to an old one. The closest parallel to the Connector is a Norwegian study by Theisen and Emblem (2021). In 2009 a new highway opened roughly parallel to an existing coastal road, cutting one-way commutes to the region's main town by 10 to 15 minutes. House prices in the towns it served rose by about 5% on average compared with towns it did not — but the effect "differed substantially between the towns", and the full effect appeared when the road opened.
It depends
In both studies, the price effect tracked how much the road actually improved access. Places that gained a lot of time gained the most. Places that were already well connected gained little or nothing, and homes right beside a new interchange carried a noise and traffic cost.
What these studies can and cannot tell you about the Gold Coast: they are overseas markets, measured over different periods, and each result is an average relative to a comparison area — not a guarantee for any one street. They do give a useful way to read the Connector. Its benefit is designed to go mainly to local trips in the Coomera–Helensvale–Nerang corridor. For homes very close to the alignment, Infrastructure Australia's evaluation lists noise and amenity among the project's impacts; TMR has committed to more than 77,000 square metres of noise barriers under the state's Transport Noise Management Code of Practice. For a buyer, being a few minutes from an interchange and being beside the motorway are different trade-offs — and in the studies above, both showed up in what people paid.
What homes along the route sell for
This is where Fields' own data comes in. We track sold homes across the Gold Coast, so we can set out what houses have actually changed hands for in the suburbs along the corridor over the last twelve months.
Suburb
Median house sale
Middle half of sales
Sales
Pimpama
$1,005,000
$940,000 – $1,200,000
261
Coomera
$1,080,000
$980,000 – $1,395,000
241
Upper Coomera
$1,100,000
$995,000 – $1,252,500
214
Nerang
$1,100,000
$995,000 – $1,277,500
123
Oxenford
$1,165,000
$1,043,500 – $1,425,000
121
Pacific Pines
$1,200,000
$1,075,000 – $1,296,250
110
Molendinar
$1,242,500
$1,041,250 – $1,415,000
58
Parkwood
$1,325,000
$1,150,000 – $1,500,000
81
Helensvale
$1,395,000
$1,200,000 – $1,937,500
221
Houses only. Sales recorded by Fields between 22 September 2025 and early September 2026. "Middle half" is the range from the 25th to the 75th percentile. Our records capture most but not all sales, and a suburb median over fewer than ~100 sales (Molendinar, Parkwood) moves noticeably with the mix of homes that happened to sell.
Two things stand out. First, the corridor is not one market: the middle half of Helensvale sales spans almost $740,000, while Pimpama's spans $260,000 — a far wider range of homes changes hands in one than the other. Second, most of the corridor sits around the $1,000,000 to $1,200,000 mark for a house — below the rolling twelve-month medians on our southern Gold Coast market charts for Robina ($1,495,000), Varsity Lakes ($1,400,000) and Burleigh Waters ($1,925,000) to June 2026, which are calculated from a fuller sales set.
Can you see the road in the prices yet?
What the sales data shows so far: not yet, and not cleanly.
Nerang — where the Connector meets the M1 — has the longest sales history in our records along the route. Its median house sale was $460,000 in 2019 (157 sales) and $995,000 in 2025 (135 sales). More than doubled. But almost all of that rise happened before any of the new road opened, and much of it before the Central and South sections had even started construction. Over the same years, the rolling median on our Robina chart went from $760,000 (end of 2019) to $1,465,500 (end of 2025) — a similar rise, in a suburb well south of where the Connector ends.
So the price record along the corridor mostly tells the story of the Gold Coast's wider run since 2019, not of one road. The research above suggests any road effect would be a few percentage points, unevenly spread — small next to a doubling, and easy to lose in it. The Dutch study also found much of the effect arrived before completion, which makes it harder still to separate from the wider market. When the Central and South sections open and the full 16 kilometres is carrying traffic, it will be possible to compare sales close to the new interchanges with sales further away. We will look at that when there is enough data to say something honest about it.
This is the kind of question Fields exists to answer with evidence rather than assertion. For the three southern suburbs we cover in depth — Robina, Varsity Lakes and Burleigh Waters — our market pages track prices, sales volumes and selling times each month, and our guide to the fundamentals of the Gold Coast market sets the Connector alongside the other major projects shaping the city.
Licensed Queensland real estate agent, founder of Fields Real Estate and Lead Analyst at Fields Research. Covering Gold Coast market data, comparable sales analysis and suburb intelligence.
Where does your own home sit?
Fields keeps a record of every active listing and recent sale across the southern Gold Coast, and reads any address against the sales around it — the comparables, the range they support, and the method behind it. This analysis of the Gold Coast comes from the same database.