What do comparable sales say about your home?Your home vs recent sales
Enter your address to see the comparable sales around it. Free, no sign-up.Free comparable sales for your address.
🔍
Analyst21 August 2026·Updated 20 September 2026·8 min read
The median house price is the most misread number in property
The median is the most quoted number in property and the most misread. Five ways it misleads — shown on Gold Coast data, including one time it misled us.
The median price is the most quoted number in Australian property and the most misread. It appears in headlines, in appraisals, in dinner-party conversation, and in the figure you carry in your head about what your home is worth.
It is a genuinely useful number. It can also move substantially without a single home changing in value — and stay still while the market underneath it shifts. Here are four ways it misleads, each shown on Gold Coast data.
First, what a median actually is
Line up every home that sold in an area over a period, cheapest to dearest, and the median is the one in the middle. Half sold for more, half for less.
It is not an average, which is why a single $12,000,000 sale does not drag it upward. That resistance to extremes is why it is the preferred measure. But note what it describes: the middle of the homes that happened to sell — not the middle of the homes that exist, and not any particular home. Change which homes sell, and the median moves, even if every home in the suburb is worth exactly what it was worth yesterday. That is the root of every trap below.
Trap 1: the mix changes, and the median follows
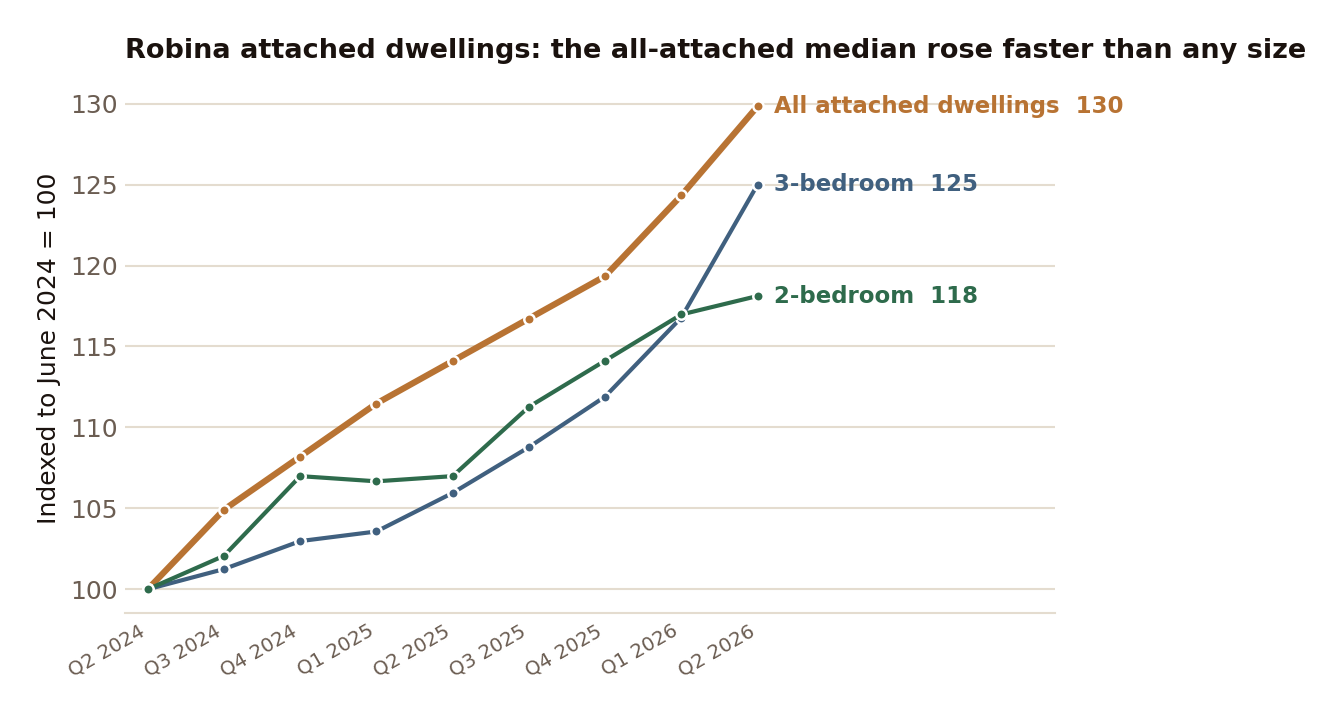
Between the June quarter of 2024 and the June quarter of 2026, the median price of an attached dwelling in Robina — units, townhouses and villas together — rose 30%. Over the same two years, two-bedroom units in Robina rose 18%, and three-bedroom units 25%.
Both are below 30%. So how did the combined figure beat both of its components? Because the mix shifted. More larger dwellings sold in 2026 than in 2024, and larger dwellings cost more. The middle of the list moved up the size range, so the middle of the list got more expensive — without any individual dwelling doing anything unusual.
An owner of a two-bedroom unit in Robina who read that attached dwellings were up 30% would be reading a number that was never about their home. Theirs was up 18%.
Each line starts at 100 in June 2024. The all-attached median (copper) climbs above both the two-bedroom and three-bedroom lines — not because any single size rose that fast, but because the mix of what sold shifted toward larger dwellings.
This is why the suburb pages carry the bedroom breakdown alongside the headline. The headline is context; the breakdown is the answer.
Trap 2: “dwellings” and “houses” are different questions
You will regularly read that one capital city has overtaken another on median price. Sometimes that is true. Often it is a weighting artefact.
“Dwelling” medians combine houses and units into a single figure, and cities do not hold those in the same proportions — Melbourne has roughly double the ratio of units to houses that several other capitals do. Units are cheaper, so a city with proportionally more units shows a lower “all dwellings” median than a city with the same house prices and fewer apartments. The comparison is partly measuring what kind of housing each city built.
The same applies locally, and more sharply, because these suburbs differ enormously in composition. Of the homes currently for sale in Robina, roughly half are attached dwellings; in Burleigh Waters, houses outnumber attached listings by nearly three to two. A combined figure for each, compared against the other, would say as much about what was built there as about what it is worth. That is why every median here is labelled houses or attached dwellings — they are separate markets, and they have not been moving together.
Trap 3: the sample is often too small to carry the claim
Whenever you are shown a median, the useful question is: how many sales is that? If the answer is not offered, the number is doing less work than it appears to.
A median is only as steady as the number of sales behind it. Take Robina's June quarter 2026: its house median came from 55 sales. The March quarter had 72. Compare the two and you get an apparent fall of nearly ten per cent — but the confidence interval around those two quarters is too wide for the difference to be distinguishable from chance. It might be a real fall; it might be fifty-five homes that happened to differ from the seventy-two before them. The data flags it as unreliable, so it is not a figure to publish.
Burleigh Waters is starker. Of its last nine quarterly medians, one carries a sample tight enough to rely on; the margins on the others range from 7.9% to 38.7%. A quarterly median with a 38.7% margin is not a market fact — it is a rough indication with a number attached.
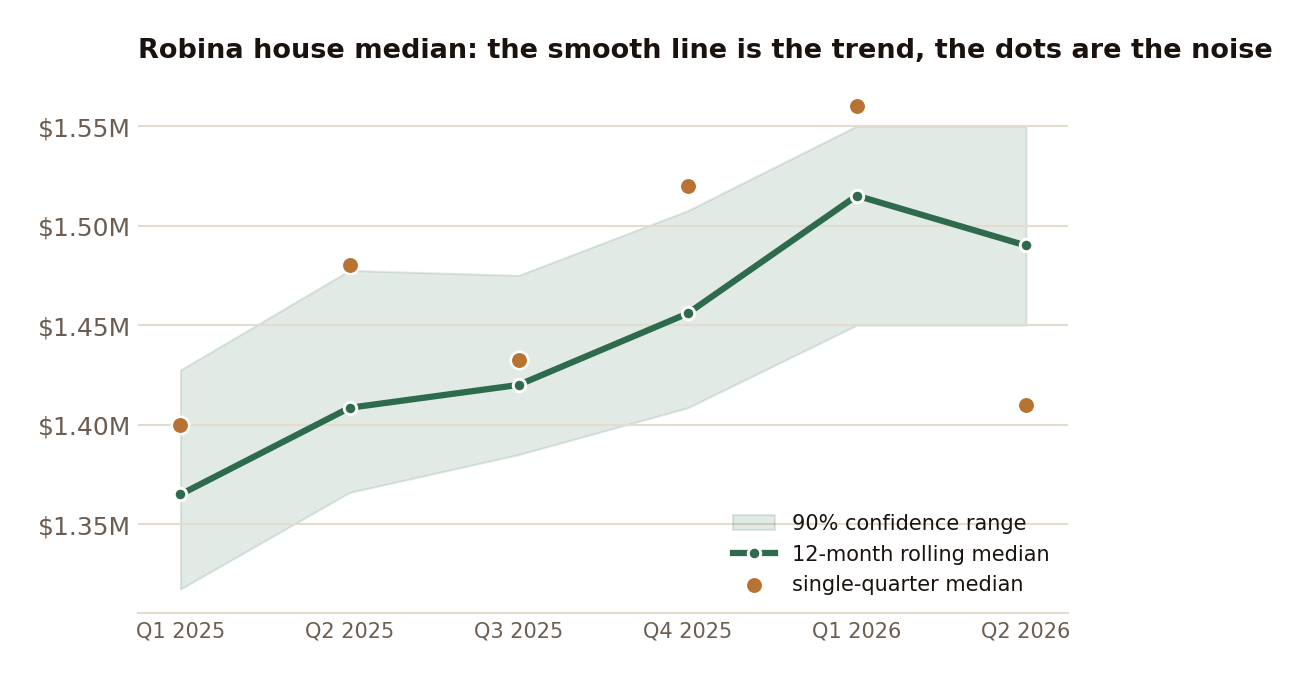
This is why twelve-month rolling medians are the headline figures here, not quarterly ones. Robina's rolling median — $1,492,500 — rests on 270 sales rather than 55, with a margin of 3.9% rather than 9.9%. It moves more slowly: less responsive, far more reliable.
The green line is the twelve-month rolling median, with its 90% confidence range shaded. The copper dots are single-quarter medians: they scatter widely around the trend, and the June 2026 quarter (bottom right, about $1.41M) sits well below it — which is why one quarter, on its own, is not a reliable read. The pills switch between the twelve-month, single-quarter and three-month rolling (trailing-90-day) medians; hover or tap any point for the figure and the number of sales behind it.
Trap 4: asking prices and sold prices are not the same measure
In Burleigh Waters right now, the median asking price across currently listed houses is $2,324,500. The median price houses actually sold for over the past twelve months is $1,925,000. That is a gap of about 21%, and it would be easy — and wrong — to read it as sellers asking far more than the market will pay.
The two figures describe different populations. The sold median covers everything that transacted across the whole suburb over a year. The asking median covers the homes standing on the market today, which currently skew toward larger and canal-front properties, up to $5,995,000 — and expensive homes take longer to sell, so at any moment they are over-represented among what is listed. Comparing the two describes the composition of current stock, not negotiating margins in either direction.
The chart below places the two measures side by side over time, for houses. The green line is the twelve-month rolling median of what Burleigh Waters houses actually sold for — $1,925,000 in mid-2026 — with its confidence band shaded. The copper line is what sellers were asking: SQM Research's weekly asking-price series for the wider postcode 4220, which also takes in Burleigh Heads and Miami. Asking has run above sold for most of the past decade, which is normal — sellers list high and negotiate down. But the gap is not a fixed discount: it widens and narrows with sentiment and with the mix of what is listed. Asking peaked near $2,400,000 in December 2025, then eased to about $1,952,000, closing much of the distance to the sold line.
Burleigh Waters houses, asking versus sold — the pills switch between asking, twelve-month, three-month and quarterly sold medians; hover or tap any point to read the figures and the number of sales behind them.Green: the twelve-month rolling median of recorded house sales in Burleigh Waters ($1,925,000 in mid-2026), confidence band shaded. Copper: SQM Research's weekly asking-price series for postcode 4220 — Burleigh Waters, Burleigh Heads and Miami — $1,952,000 in late August 2026, after a December 2025 peak near $2,400,000. Asking is what sellers list at; sold is what buyers paid. They are different populations over slightly different areas, which is the point. Note too that the $2,324,500 quoted above — the midpoint of houses on the market in Burleigh Waters today — sits above both lines, because current stock skews to the largest homes.
A further complication: 38% of Robina listings carry no published price, shown as “contact agent”, “auction” or similar. Any asking-price median is therefore built only on the homes that stated a figure — not a random sample. Choosing not to publish a price is a normal and lawful marketing decision, but it means asking-price statistics rest on a self-selected subset.
How to read a median
Four questions make almost any median interpretable:
Houses or all dwellings? If it does not say, assume they are mixed — and assume the comparison is affected.
How many sales? Under about fifty, quarter-to-quarter movements are mostly noise.
Sold or asking? They measure different populations and are not comparable.
Over what period, and who compiled it? A rolling twelve-month figure and a single-quarter figure will disagree, and neither is wrong.
The median remains the best single number for describing a market. It is just not a valuation, not your home, and it carries an error bar that is rarely printed beside it. Every suburb median here is published with its sample size and confidence interval, including when the sample is thin and the margin wide.
Sources: Fields Estate transaction data for Robina, Varsity Lakes and Burleigh Waters, twelve months to 2 August 2026, compiled from public sale records, with dwelling type classified per property. Sample sizes and confidence intervals are published on each suburb's Market Intelligence page. Listing figures as at 20 August 2026.
Keep reading:Gold Coast market data — prices, supply and selling times, updated as new sales settle.
Licensed Queensland real estate agent, founder of Fields Real Estate and Lead Analyst at Fields Research. Covering Gold Coast market data, comparable sales analysis and suburb intelligence.
Where does your own home sit?
Fields keeps a record of every active listing and recent sale across the southern Gold Coast, and reads any address against the sales around it — the comparables, the range they support, and the method behind it. This analysis of the Gold Coast comes from the same database.