What do comparable sales say about your home?Your home vs recent sales
Enter your address to see the comparable sales around it. Free, no sign-up.Free comparable sales for your address.
🔍
Analyst29 October 2026·Updated 29 October 2026·10 min read
Someone Paid $360,000 for This Highland Park Home in 2016. It Just Sold for $1,180,000.
9 Jabiluka Drive, a renovated three-bedroom house on 701 m², sold for $1,180,000 in August 2026, ten years after a $360,000 purchase. How the change compares with the Highland Park median, what changed in between, the sales nearby, and a market where homes are taking longer to sell.
A Highland Park home bought for $360,000 in 2016 sold for $1,180,000 in August, after a renovation that added a new pool and kitchen. This article sets that result beside what the typical Highland Park house did over the same ten years, what changed at the home, the sales around it, and how long its campaign took, in a Gold Coast market where homes are now taking longer to sell.
9 Jabiluka Drive, Highland Park, sold for $1,180,000 in August 2026, ten and a half years after it last changed hands for $360,000 in January 2016.1 Both prices come from public sales records. The sale went through in the same months that Gold Coast homes began taking noticeably longer to sell, which makes it a useful piece of evidence: it shows what one Highland Park seller achieved in this market, not the market of a year ago.
The market around it has changed since the autumn. Across 22 Gold Coast postcodes, homes that had been listed for 60 to 180 days without selling rose from 1,288 in March 2026 to 2,707 in September, the latest month published. A year earlier, in September 2025, the figure was 1,479.2 The median Gold Coast house that sold in the three months to September had been on the market for 40 days, across 708 sales, up from 26.5 days for the three months to March.3 And on 29 September 2026 the Reserve Bank raised the cash rate to 4.60%; its next decision is due on 3 November.4 I set out what these indicators have historically been associated with in Unsold Gold Coast homes have doubled since March. This article looks at one sale inside that picture.
+$820,000
The difference between the 2016 purchase price of $360,000 and the 2026 sale price of $1,180,000: an increase of 227.8% over ten and a half years. That is a gross figure. Sales records do not show stamp duty, selling costs or what was spent on the home in between, and in this case the listing shows a good deal was.
How the result compares with the suburb
The fairest yardstick is what Highland Park house prices did over the same stretch. On the Fields rolling twelve-month median, the typical Highland Park house sold for $492,000 in the twelve months to March 2016, across 118 house sales. In the twelve months to September 2026 it was $1,248,500, across 58 house sales.5 That is a rise of 153.8%.
Measure
2016
2026
Change
9 Jabiluka Drive (sale price)
$360,000
$1,180,000
+227.8%
Highland Park houses, rolling 12-month median
$492,000
$1,248,500
+153.8%
Source: public sales records (9 Jabiluka Drive); Fields market charts, Highland Park houses, rolling twelve-month median sale price for the windows ending March 2016 and September 2026. The purchase sits inside the first window and the sale inside the second.
This home outran the suburb by a wide margin. It was bought for about 27% less than the typical Highland Park house in 2016 and sold for about 5% less in 2026, closing most of that gap. The records point to the likely reason, which is what happened to the house in between.
What changed in between
When it sold in 2016, the listing described a three-bedroom, one-bathroom home on a quiet street, with open-plan living, a good-sized kitchen, air conditioning, a separate laundry, a large yard and a big outdoor entertaining area. It was pitched to first home buyers and empty nesters.6
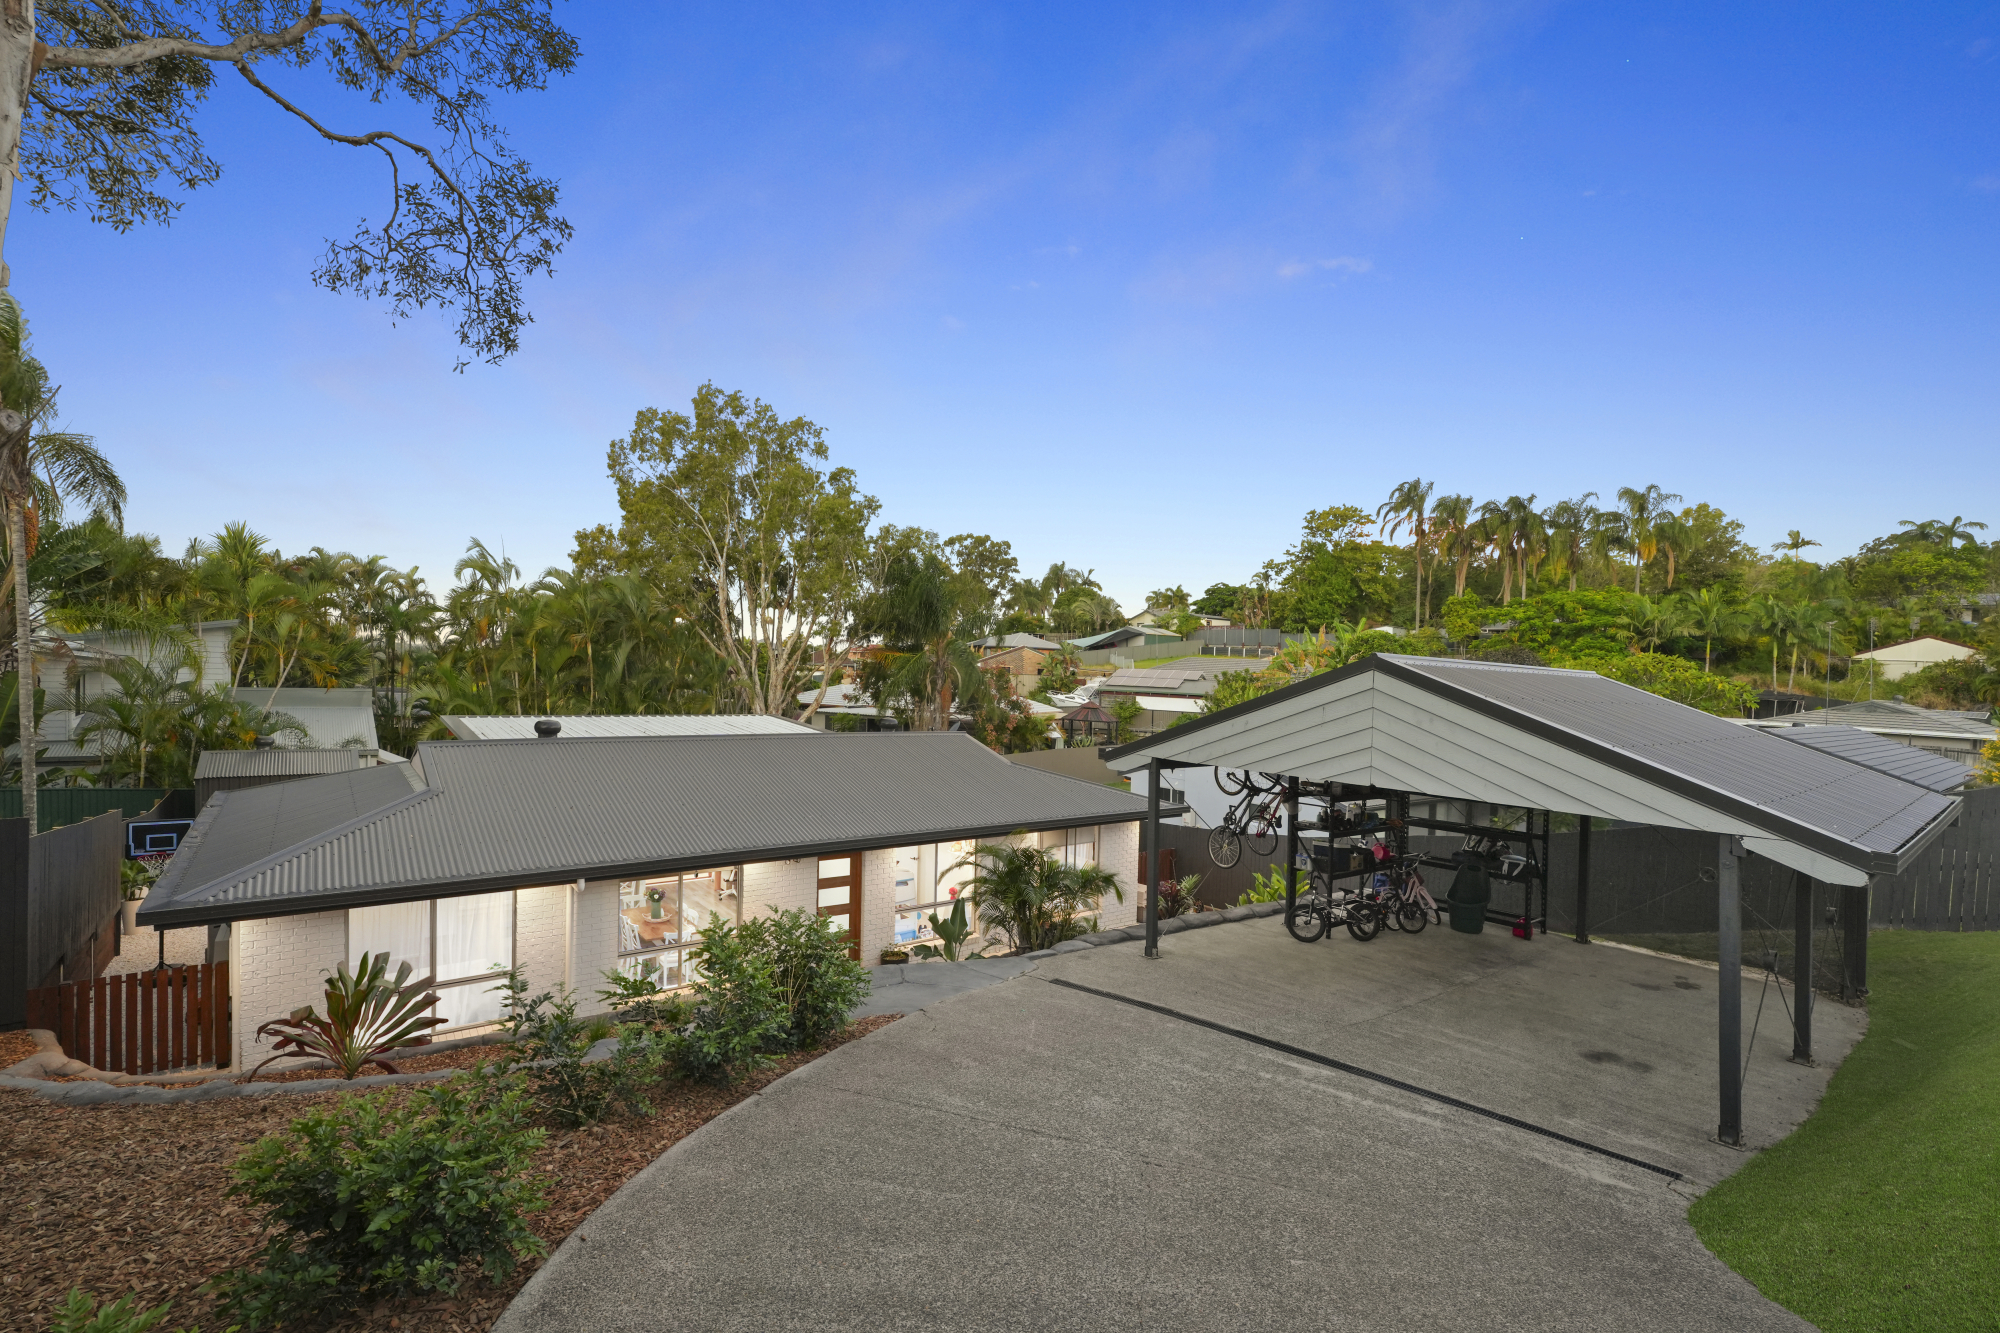
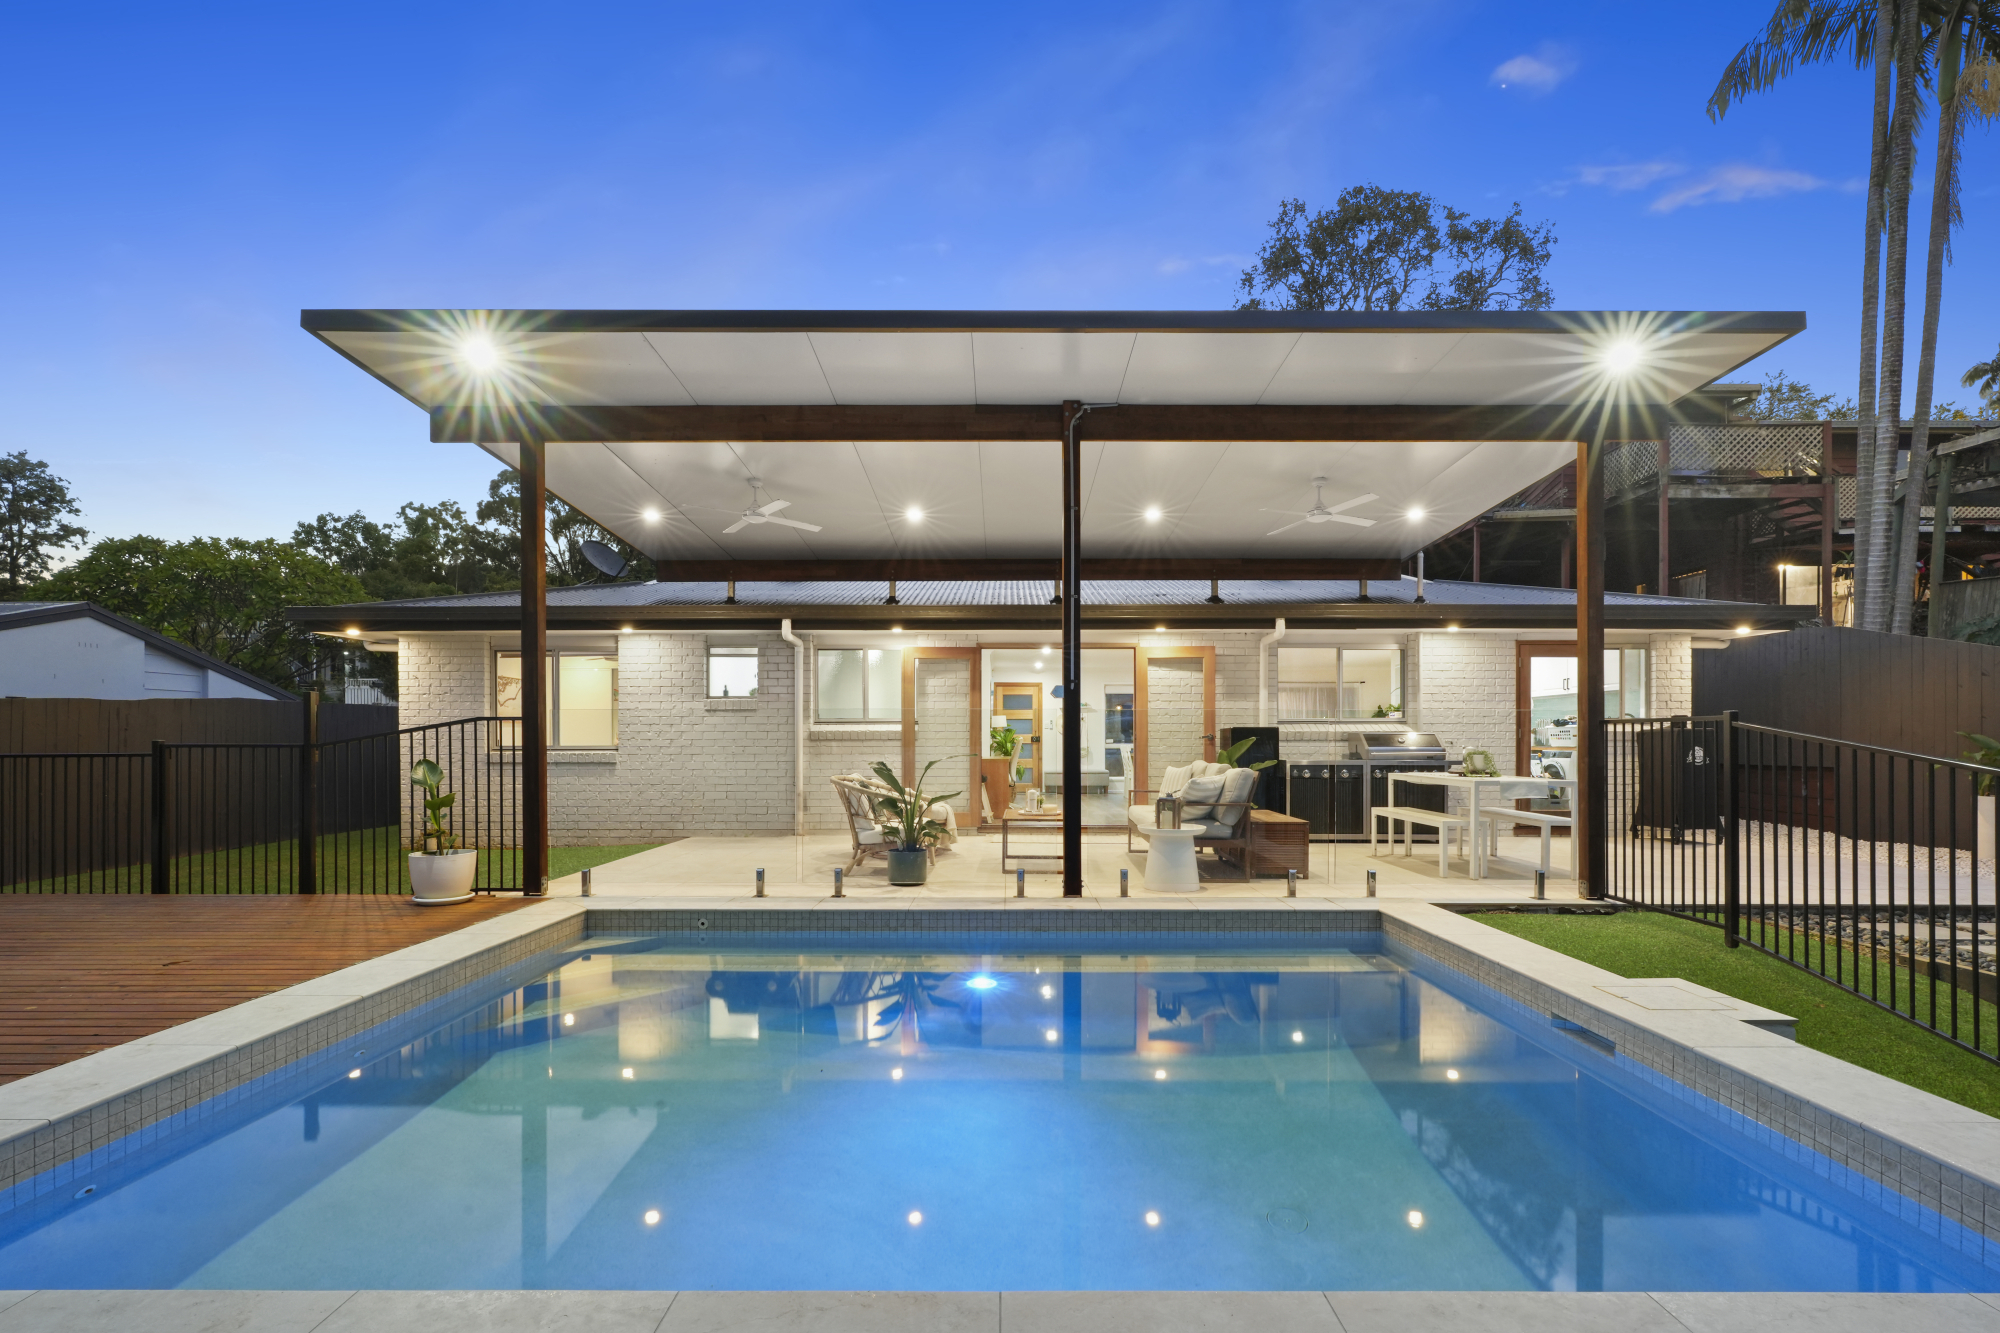
The 2026 listing describes the same three-bedroom home updated throughout: a renovated kitchen with a butler's pantry and laundry, a renovated bathroom, a brand-new pool area, a large covered patio, a storage or work shed, and a fully fenced block with an electric gate.7
9 Jabiluka Drive, front, 2026 campaign photo.
So the 227.8% is not a pure market figure. It combines ten years of Highland Park price growth with a renovation the records do not cost. If the house had simply kept pace with the suburb, $360,000 in 2016 would correspond to roughly $914,000 at today's median. The sale came in about $266,000 above that. That difference is not a measure of what the renovation cost or what it was worth on its own, because other things also changed over ten years. It is the part of the result that ordinary suburb growth does not explain.
9 Jabiluka Drive, pool and covered patio, 2026 campaign photo.
What the records show about the home
Our property record holds a 701 m² block and a house of about 92 m² built around 1985, with three bedrooms and one bathroom.8
In the twelve months to September 2026, Fields records hold 25 three-bedroom Highland Park house sales. Their median price was $1,167,700, and this sale landed $12,300 above it. Their median block was 819 m², and 5 of the 25 sat on less land than 9 Jabiluka Drive.9 So this is a modest-sized house on a block smaller than most three-bedroom sales, and the renovation carried it to just above the going price for a three-bedroom Highland Park house. For a buyer, that combination carries its own value: the pool, kitchen and bathroom already done, on a block with less to maintain.
The sales around it
Address
Sold
Beds
Block
Price
9 Jabiluka Drive
August 2026
3
701 m²
$1,180,000
6 Toukley Court
November 2025
3
812 m²
$1,100,000
38 Quigan Terrace
April 2026
3
683 m²
$1,210,100
36 Jabiluka Drive
June 2026
3
776 m²
$965,000
11 Goodman Close
July 2025
3
736 m²
$995,000
Source: Fields sales records and public sales records.10 All are three-bedroom houses within about 290 metres of 9 Jabiluka Drive. Block sizes are cadastral lot areas; bedroom counts are from our property records.
Four three-bedroom houses within about 290 metres sold between $965,000 and $1,210,100 over the past year or so. 9 Jabiluka Drive's $1,180,000 sits near the top of that range, just below 38 Quigan Terrace and above 36 Jabiluka Drive on the same street, which sold for $965,000 in June. We cannot see inside these homes or their contracts, so the table shows what each sold for, not why.
The campaign
Our listing record shows the home first advertised on 7 May and, at one stage, priced at offers over $1,250,000. It sold by private treaty for $1,180,000, $70,000 or 5.6% below that figure, about three months after it was first advertised.1 For context, across the twelve months to September 2026 the median Highland Park house that sold had been advertised for 18.5 days, across 20 sales. Across the five Nerang and Carrara area suburbs we pool for selling times, the median house sold in the June quarter of 2026 had been advertised for 19 days, across 45 sales, and in the September quarter 41.5 days, across 14 sales.11 This campaign ran through the months when that figure more than doubled.
I have given the month rather than a date. The property's public sales history and our listing record date the sale 4 August 2026; a second sold record dates it 4 September. Both give the same price.
What this one sale can and cannot tell you
One sale does not set a market, and this result was agreed in winter, before the September rate rise. Since then the Gold Coast indicators above have continued to describe longer selling times and more unsold stock.
What the sale does show is narrower and firmer. A renovated three-bedroom Highland Park house sold in mid-2026 just above the suburb's three-bedroom median, and over ten years its owners' result ran well ahead of the suburb's, with a renovation the listing set out. Whether results like this continue as stock builds is something the next few months of recorded sales will show, and I will report them as they come in.
Fields Real Estate was not involved in either sale of this property.
Highland Park's median, selling times and supply are charted on the Highland Park market page. If you are curious how your own home sits against recent sales nearby, you can look it up here.
References
Fields Real Estate sales records, 9 Jabiluka Drive, Highland Park. Compiled from public sale records: $360,000 (14 January 2016, private treaty, 22 days advertised) and $1,180,000 (August 2026, private treaty; first advertised 7 May 2026). ↩
SQM Research, total property listings by postcode. All dwelling types, homes listed 60 to 90 and 90 to 180 days combined, summed across 22 Gold Coast postcodes: 1,479 (September 2025), 1,288 (March 2026), 2,707 (September 2026); retrieved 29 October 2026. ↩
Fields Real Estate sold-property records, Gold Coast suburb panel. Median days from advertised date to sold date, houses, 64 Gold Coast suburbs, sales advertised three days or fewer excluded: 26.5 days for the three months to March 2026 (784 sales); 40 days for the three months to September 2026 (708 sales); recomputed 29 October 2026. ↩
Highland Park property market, Fields Real Estate. Houses, rolling twelve-month median sale price: $492,000 for April 2015 to March 2016 (118 sales); $1,248,500 for October 2025 to September 2026 (58 sales). ↩
9 Jabiluka Drive, Highland Park, 2016 sale campaign listing. Advertised listing description, paraphrased. ↩
9 Jabiluka Drive, Highland Park, 2026 sale campaign listing. Advertised listing description, paraphrased. ↩
Fields Real Estate property record, 9 Jabiluka Drive, Highland Park. Cadastral lot area 701 m²; floor area about 92 m²; year built 1985; three bedrooms, one bathroom. ↩
Fields Real Estate sales records, Highland Park houses. Three-bedroom house sales October 2025 to September 2026: 25 sales, median $1,167,700, median block 819 m². ↩
Fields Real Estate sales records, Highland Park houses near Jabiluka Drive. Compiled from public sale records; three-bedroom houses within about 290 metres sold July 2025 to June 2026. ↩
Highland Park and Nerang–Carrara days on market, Fields Real Estate market charts. Median days advertised, final campaign, houses, sales advertised three days or fewer excluded: Highland Park 18.5 days for the twelve months to September 2026 (20 sales); Nerang, Carrara, Merrimac, Highland Park and Gilston pooled, 19 days for the June quarter 2026 (45 sales) and 41.5 days for the September quarter 2026 (14 sales). ↩
Method notes. Purchase: $360,000, dated 14 January 2016 in public sales records. Sale: $1,180,000, private treaty; dated 4 August 2026 in the property's public sales history and our listing record, and 4 September 2026 in a second sold record, so the month is given. The 227.8% change is gross and excludes transaction costs and any money spent on the home. The "kept pace" figure of about $914,000 is $360,000 multiplied by the change in the Highland Park twelve-month house median ($492,000 to $1,248,500); it is an illustration, not a valuation. Advertised price: our listing record holds "offers over $1,250,000"; the 2026 listing text also says the home was offered without a price, so the guide may have changed during the campaign. Days advertised: 89 days from 7 May to 4 August on our listing record; the public sales history gives 102. Bedroom-based comparisons use the bedroom counts on our records for each sale. Listing descriptions are paraphrased. Fields records cover the sales we hold, not necessarily every sale in the suburb. This article reports data and does not constitute advice.
Licensed Queensland real estate agent, founder of Fields Real Estate and Lead Analyst at Fields Research. Covering Gold Coast market data, comparable sales analysis and suburb intelligence.
Where does your own home sit?
Fields keeps a record of every active listing and recent sale across the southern Gold Coast, and reads any address against the sales around it — the comparables, the range they support, and the method behind it. This analysis of the Gold Coast comes from the same database.