What do comparable sales say about your home?Your home vs recent sales
Enter your address to see the comparable sales around it. Free, no sign-up.Free comparable sales for your address.
🔍
Analyst14 October 2026·10 min read
Under 1% of borrowers in negative equity, RBA finds. Gold Coast stock is rising as homes take longer to sell
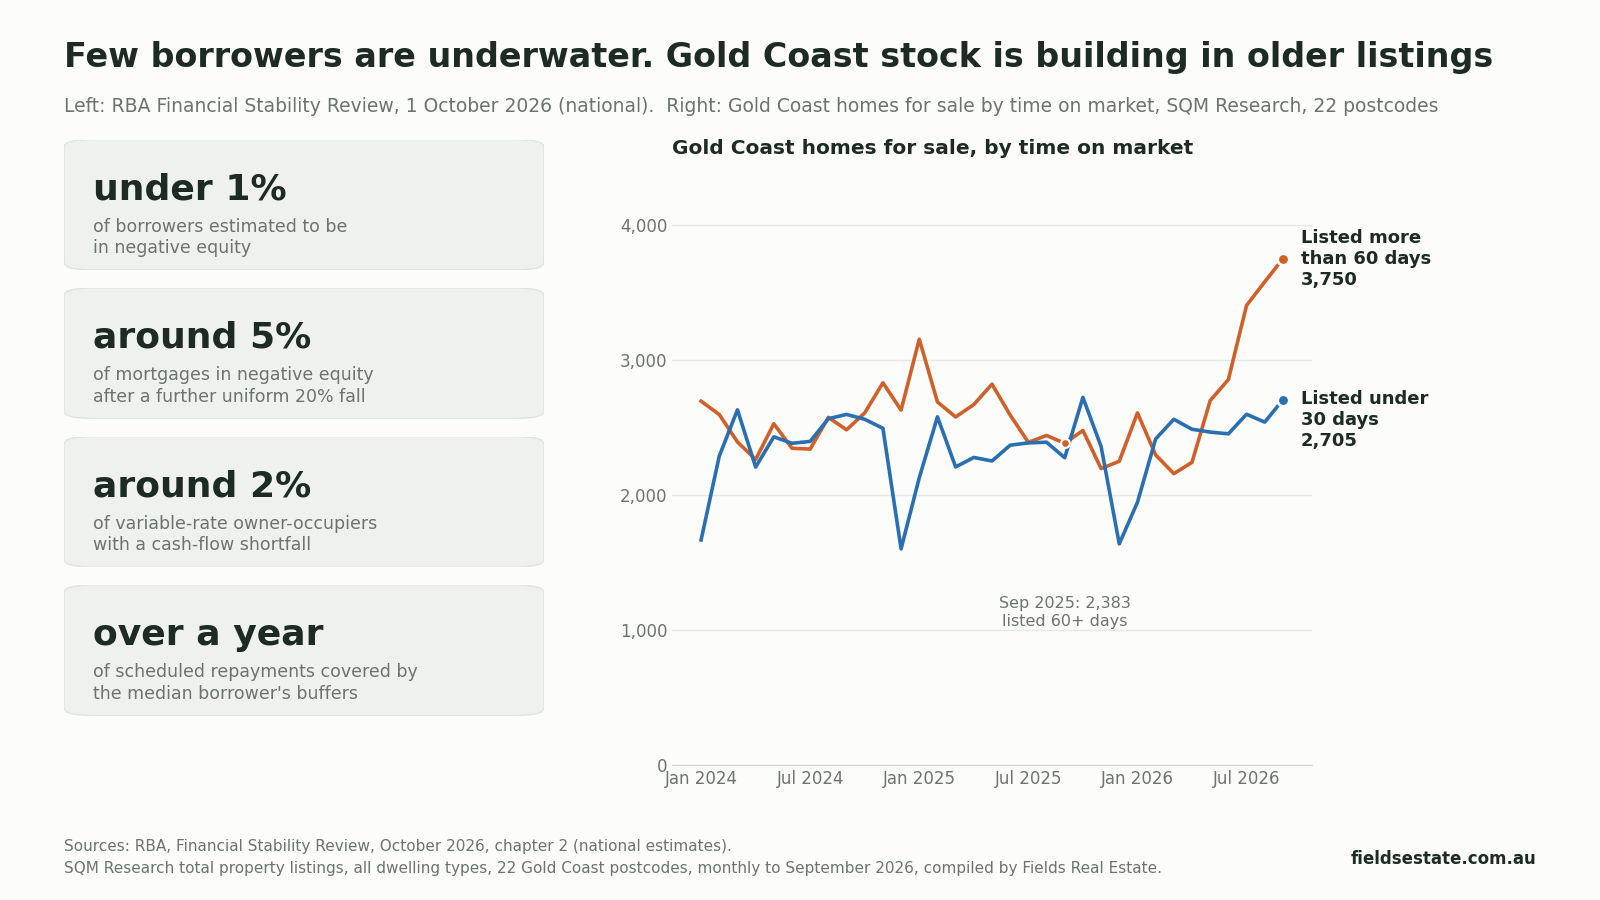
The RBA's October Financial Stability Review estimates under 1% of borrowers are in negative equity. Gold Coast stock is up 38.9% in a year, mostly in homes listed more than 60 days.
The Reserve Bank's October Financial Stability Review estimates that fewer than 1 in 100 Australian borrowers owe more than their home is worth. This article sets out what the RBA measured about arrears, savings buffers and negative equity, then uses September listing counts to show which Gold Coast homes are behind this year's rise in stock: new sellers, or homes taking longer to sell. It also covers what the national figures cannot tell us locally.
The Reserve Bank of Australia released its October 2026 Financial Stability Review on Thursday
1 October.1 It estimates that less than 1 per cent of Australian
borrowers owe more on their loan than their home is worth, and that even after a further uniform fall
in housing prices of 20 per cent, "only around 5 per cent of mortgages would fall into negative
equity".2 The review came two days after the RBA lifted the cash rate to 4.60%, its fourth
increase this year.3,2
Those figures speak to a specific worry that comes up in a lot of conversations right now: that
owners who can no longer afford their mortgage will be forced to sell, and that a wave of forced
sales will flood the market. On the Gold Coast, the number of homes for sale has risen sharply this
year. This piece looks at what the RBA measured about forced selling, and at which homes are actually
behind the rise in local stock.
First, what the review does not say
The review is not a statement that prices will hold. Prices are already falling nationally. Cotality's
Home Value Index fell 1.1% in September, the sixth straight monthly fall, leaving national values 5.2%
below their March peak. Brisbane recorded the steepest monthly fall of the capitals, at 1.5%.4
The RBA itself notes that its housing price-at-risk modelling suggests "downside risks to prices are
currently elevated".2
What the review addresses is narrower: whether borrowers can keep paying, and whether, if they can't,
they could sell and clear their loan. That is the mechanism behind forced selling.
What the RBA measured
Arrears: low, up a little
The share of housing loans more
than three months behind "has increased a little over the year to date but remains around
pre-pandemic levels".2
Cash-flow shortfall: around 2%
About 2 per cent of
variable-rate owner-occupiers have income that does not cover their scheduled repayments and essential
expenses. Most of them are estimated to have savings to cover the gap for at least six
months.2
Buffers: over a year
The median borrower could cover
"over a year of scheduled mortgage payments at current interest rates" from offset and redraw savings,
and there has not been a meaningful increase in borrowers persistently drawing those buffers
down.2
Negative equity: under 1%
Less than 1 per cent of
borrowers are estimated to be in negative equity now, and around 5 per cent of mortgages would be after
a further uniform 20 per cent fall. Recent buyers and those with high loan-to-value ratios are the most
likely to be underwater.2
Equity matters because of how forced sales happen. The RBA notes that negative equity on its own is
"insufficient to trigger default if borrowers remain able to service their loans", and that if a
borrower could no longer pay and had to sell, "the vast majority would have enough equity to repay
their loans in full".2 For that borrower a sale would be difficult and disruptive, in the RBA's words, but
most would be able to clear the loan.
There are limits to read alongside these numbers. They are national estimates, built from the
RBA's securitisation data, and the review gives no breakdown for Queensland or the Gold Coast. The
RBA's own release says there are "pockets of stress".1 In its severe scenario,
with unemployment rising to 6.3 per cent and the cash rate to 5.6 per cent, the share of mortgagors at
higher risk of default rises to around 5 per cent.2 And the review names one group whose
selling could add to stock: "In periods of declining housing prices, investors may be less willing to
enter the market and more inclined to sell properties to limit losses."2 It adds that most
investors hold considerable equity, and that the grandfathering of negative gearing could motivate
some to hold on.
What is behind the rise in Gold Coast stock
In September 2026 there were 8,029 homes for sale across 22 Gold Coast postcodes,
up from 5,779 in September 2025, an increase of 38.9%.5 The more useful question is which
listings grew. SQM Research classifies every listing by how long it has been on the market.
Time on market
Sep 2025
Sep 2026
Change
Under 30 days
2,276
2,705
+429
30 to 60 days
1,120
1,574
+454
More than 60 days
2,383
3,750
+1,367
All listings
5,779
8,029
+2,250
SQM Research total property listings, all dwelling types, summed across 22 Gold Coast
postcodes, monthly to September 2026.
About six in ten of the extra listings (1,367 of 2,250) are homes that have been for sale for more
than two months. Fresh listings did rise as well: September's 2,705 homes listed for under 30 days was
the highest monthly count this year and 19% above September 2025. But most of the build-up is homes
that came to market and have not yet sold.
That matches what Cotality describes across the capitals, where new listings in September were 9.2%
lower than a year earlier while total inventory was 23.1% higher: "Despite fewer new listings entering
the market, inventory levels have risen sharply because the rate of sale has fallen even
faster."4
For context, the September 2026 total is the highest September count since 2020, and still below
every September from 2011 to 2020, when between 10,112 and 13,952 homes were for sale in the same
postcodes.5
Robina, Varsity Lakes and Burleigh Waters
Postcode
Sep 2025
Sep 2026
Change
4226 (Robina)
167
302
+81%
4227 (Varsity Lakes)
109
158
+45%
4220 (Burleigh Waters)
319
344
+8%
SQM Research total property listings, all dwelling types, by postcode. Postcode areas
are wider than the suburbs they are named after.
The Robina postcode has seen the biggest rise of the three, and the Burleigh postcode the smallest.
Slower sales and forced sales are different signals
A forced sale happens when an owner must sell whatever price they can get. A slow market is one where
owners who choose to sell are waiting longer for a buyer, and can usually adjust their price, withdraw
or wait. Both add to the count of homes for sale, which is why a rising stock figure on its own doesn't
say which one is happening.
No public data source counts forced sales on the Gold Coast. One narrow check is how homes are
advertised. Across the 2,799 homes our own listing records showed as for sale in the 68 Gold Coast
suburbs we track, as last refreshed on 4 October 2026, none was advertised as a mortgagee
sale.6 Agents do not always label a mortgagee sale, so this is a floor rather than a
count, but it is consistent with the RBA's national picture.
Cotality's October report reaches a similar view on the cause: relatively low unemployment "should
limit the risk of a material rise in mortgage arrears or forced selling", while it adds that a more
pronounced deterioration in labour market conditions would add to the downside risks.4
That is Cotality's assessment, not ours. It does point to the indicator that would change the picture:
the RBA links borrowers' ability to keep paying to the strength of the labour market.2
What a build-up like this has been associated with
Rising stock from slower sales is still a supply build-up, and supply has its own history. Cotality
says the current accumulation leaves buyers with "more choice, reduced urgency, and greater scope to
negotiate, while vendors are having to become more realistic about their price
expectations".4
On the Gold Coast, the last comparable run-up was in 2022, when homes listed 60 to 180 days rose 55%
between March and August. Over the following year, annual growth in our Gold Coast composite price
measure slowed from 34.6% to 3.3%.7 Two cautions apply, as set out in
our earlier look at unsold
stock: 2022 was also the year rate rises began, so the two cannot be separated, and growth on that
measure slowed but stayed positive. A rise in unsold stock has preceded slower price growth before. On
this series it has not, by itself, reliably preceded falling prices.
Put together, the national evidence in the review points to borrowers who are mostly able to keep
paying and mostly hold equity. The local evidence points to stock building because homes are taking
longer to sell. Those are separate indicators, and the next Financial Stability Review, along with
the monthly listing counts, will show whether either moves.
2. Resilience of Australian Households and Businesses. Reserve Bank of Australia, Financial Stability Review, October 2026. National estimates; negative-equity and scenario figures use the RBA's Securitisation System data. ↩
Cotality Home Value Index, October 2026. Cotality, released 1 October 2026, data to 30 September 2026. Includes commentary by Tim Lawless and Cotality's outlook. ↩
Total property listings, by postcode. SQM Research. All dwelling types, monthly counts by time on market, summed by Fields Real Estate across 22 Gold Coast postcodes; series from January 2010 to September 2026, retrieved 1 October 2026. ↩
Fields Real Estate listing records. 2,799 Gold Coast homes marked for sale across 68 suburbs, listing data last refreshed 4 October 2026; advertising text searched for mortgagee-sale wording. ↩
Fields Gold Coast composite price measure and SQM listing-age series. Fields Real Estate. Transaction-weighted combination of rolling twelve-month median sale prices across 63 Gold Coast suburbs, annual change, March quarter 2022 to June quarter 2023; listings 60 to 180 days from SQM Research, March and August 2022. ↩
Notes. RBA figures are national estimates from the October 2026 Financial Stability Review; the review gives no Queensland or Gold Coast breakdown. Gold Coast stock counts are SQM Research total property listings, all dwelling types, summed across 22 postcodes; postcode areas are wider than the suburbs they are named after, and the latest month can revise. The mortgagee-sale check covers advertising text in our own listing records as last refreshed on 4 October 2026, and is a floor because agents do not always label a mortgagee sale. Past relationships are reported as history only. This article reports data and does not constitute advice.
Licensed Queensland real estate agent, founder of Fields Real Estate and Lead Analyst at Fields Research. Covering Gold Coast market data, comparable sales analysis and suburb intelligence.
Where does your own home sit?
Fields keeps a record of every active listing and recent sale across the southern Gold Coast, and reads any address against the sales around it — the comparables, the range they support, and the method behind it. This analysis of the Gold Coast comes from the same database.