What do comparable sales say about your home?Your home vs recent sales
Enter your address to see the comparable sales around it. Free, no sign-up.Free comparable sales for your address.
🔍
Analyst14 October 2026·Updated 11 October 2026·7 min read
Houses that cut their asking price took a median 68 days to sell. Those that didn't took 39
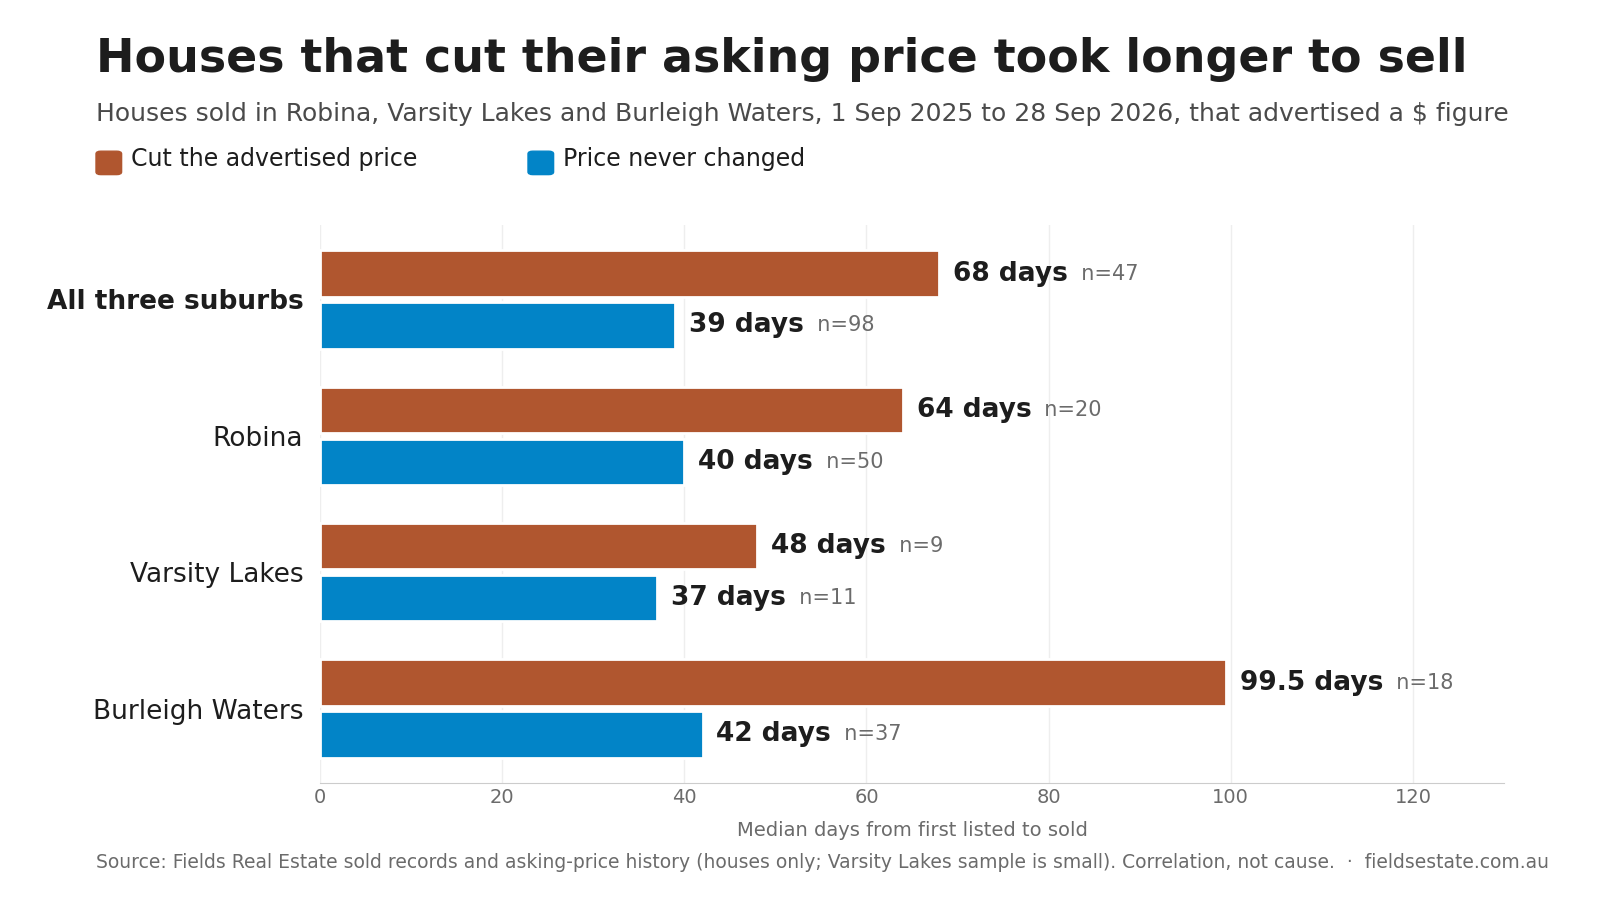
Houses in Robina, Varsity Lakes and Burleigh Waters that publicly cut their advertised price took a median 68 days to sell (47 houses), against 39 days for houses whose price never changed (98 houses). Houses sold 1 September 2025 to 28 September 2026 that showed a dollar figure.
Some houses for sale change their advertised price before they sell, and most never do. This article compares the two groups among houses sold in Robina, Varsity Lakes and Burleigh Waters between 1 September 2025 and 28 September 2026: how long each took to sell, how close each sold to its first advertised figure, and how the pattern differs by suburb. It also sets out what the comparison cannot show, including which came first, the cut or the long campaign.
Houses in Robina, Varsity Lakes and Burleigh Waters that publicly cut their advertised price took a
median of 68 days to sell. Houses whose advertised price never changed took a median of
39 days. That is the result of Fields Real Estate's analysis of every house sold in the
three suburbs between 1 September 2025 and 28 September 2026 that showed a dollar figure while it was
on the market, re-run against our records on 11 October 2026.1
The gap appears in all three suburbs. It also comes with a caution that matters as much as the
numbers: a price cut and a long campaign tend to arrive together, and the data cannot say which one
causes the other.
The three numbers
1
68 days against 39
Median days from first listed to sold: 68 for the 47 houses that
cut their advertised price, 39 for the 98 that never changed it.1,2
2
55% against 19% on the market for more than 60 days
More than half of the price-cut houses (55%) were listed for more than
60 days before they sold. For houses that never changed their price, it was 19%, about
one in five.1
3
4.8% against 1.1% below the first advertised figure
The median price-cut house sold 4.8% below the first figure it
advertised (44 houses with a disclosed sale price). The median house that never changed its price sold
1.1% below it (85 houses).1,2
4
Both groups started in a similar price range
The median first advertised figure was $1,595,000 for the houses that
later cut and $1,539,500 for those that didn't, so the gap is not mainly a difference
between cheaper and dearer homes.2
Suburb by suburb
Suburb
Cut: median days
Houses
No cut: median days
Houses
Robina
64
20
40
50
Varsity Lakes
48
9
37
11
Burleigh Waters
99.5
18
42
37
All three
68
47
39
98
Houses sold 1 September 2025 to 28 September 2026.1 Burleigh Waters shows the widest gap:
the median price-cut house there took 99.5 days, and 78% of them were listed for more than 60 days. The
Varsity Lakes figures rest on only 20 sales, so they show the same direction but carry little weight on
their own.
The pattern is not confined to the early part of the period. Among houses sold from 1 June 2026 to
28 September 2026, price-cut houses took a median of 73 days (38 houses) and houses with an unchanged
price took 39 days (59 houses).1
Cause, effect, or both
These figures show that a price cut and a long campaign go together. They do not show that one causes
the other, and the relationship can run in either direction.
A cut can follow a slow campaign. A home that has been listed for several weeks without
an acceptable offer is the home most likely to have its price revised. In that case the long campaign
comes first and the cut is a response to it.
A cut can also lengthen the count. Days on market run from the first listing date, so
the weeks before a change are already on the clock when the new figure goes up.
The two groups can also differ in ways this comparison does not measure, such as condition, position
on the street or how the home was marketed. What the data does show is where the two groups ended up.
What a price change marks
Every one of the 47 price-cut houses in this analysis sold. A change to the advertised figure is not a
verdict on the home. In these campaigns it marks the point at which the asking figure moved towards
where buyers were prepared to meet it, and the sale followed.
The houses that never changed their figure tended to sell close to it, a median of 1.1% below. The
houses that did change it sold a median of 4.8% below the figure they first advertised. That difference
describes how far the first figure sat from the eventual sale. It says nothing about whether either
group of owners did better or worse than they would have otherwise.
The comparison covers only houses that showed a dollar figure at some point in their campaign:
145 of the 510 houses sold in the period with a recorded days-on-market figure. The other
365 never showed a dollar figure in our records, as is the case for listings marketed by auction,
expressions of interest or "Contact Agent", so there was no advertised figure to compare. That is common locally: about one in three homes for sale in
these suburbs shows
no price at all, and in Queensland the law bars a price guide on auction listings.
Two checks on the method gave the same answer. Leaving out eight sales with a strata-style address
(a unit-style number such as 2/15 in the street address) gave 66 days against 41. Counting a change as a cut only
when the figure fell by 3% or more gave 72.5 days against 42.1,2
Where a home's first advertised figure sits against the recent sales around it is
something the data can show for any address. Every property for sale on Fields carries a Valuation Guide
with the comparable sales behind it and the method used.
References
Fields Real Estate sold records, Robina, Varsity Lakes and Burleigh Waters. Houses sold 1 September 2025 to 28 September 2026 that advertised a dollar figure (145 houses), days from first listed to sold; analysis re-run 11 October 2026. ↩
Fields Real Estate asking-price history. Advertised price changes recorded on each of those listings while tracked, current to 4 October 2026. ↩
Notes. Houses only (property type recorded as house) in Robina, Varsity Lakes and
Burleigh Waters, sold 1 September 2025 to 28 September 2026; the most recent sale in the set is dated
28 September 2026, and days on market is not yet recorded for later sales. "Days to sell" is days from
first listed to sold, the same field behind the days-on-market charts on our Market Intelligence pages.
A "price cut" is any advertised dollar figure more than 1% below the highest figure shown before it;
where a listing showed a range, the lower figure is used. Asking-price changes are only captured while
a listing is tracked, so a change made before tracking began or between checks can be missed, and some
houses counted as "never cut" may have changed their price. Listing-level records are current to
4 October 2026. Sale prices are as recorded; undisclosed sales are excluded from the sale-versus-first-figure
comparison. This article reports data and does not constitute advice.
Licensed Queensland real estate agent, founder of Fields Real Estate and Lead Analyst at Fields Research. Covering Gold Coast market data, comparable sales analysis and suburb intelligence.
Where does your own home sit?
Fields keeps a record of every active listing and recent sale across the southern Gold Coast, and reads any address against the sales around it — the comparables, the range they support, and the method behind it. This analysis of the Gold Coast comes from the same database.