What do comparable sales say about your home?Your home vs recent sales
Enter your address to see the comparable sales around it. Free, no sign-up.Free comparable sales for your address.
🔍
Analyst11 March 2026·Updated 15 September 2026·7 min read
When Should You Sell Your Home? What 6 Years of Data Says About Market Timing
Timing the market perfectly is impossible. Timing your listing season is not. Our analysis of 6,848 house sales across Robina, Varsity Lakes, and Burleigh Waters identifies the best and worst months to list.
Timing the market perfectly is impossible. Timing your listing season is not. Our analysis of 6,848 house sales across Robina, Varsity Lakes, and Burleigh Waters from 2020 to 2025 identifies the best and worst months to list — and the difference is worth more than most sellers realise.
The Question Every Seller Asks
When is the right time to put my house on the market?
It's the most common question sellers ask — and the most commonly misanswered. The typical advice is either "spring is always best" or "whenever you're ready." Neither is grounded in what actually happens in your specific market.
We ran the numbers. Here's what six years of Southern Gold Coast data says.
The Data
Sample:
- 6,848 house sales across Robina, Varsity Lakes, and Burleigh Waters (2020–2025)
- All sale methods (private treaty and auction)
- Excludes units and townhouses (different dynamics)
- Monthly median sale price, days on market, and listing volume
Important note: All prices are expressed as a percentage above or below the annual median for that year. This strips out the overall market trend (which was strongly upward over this period) and isolates the seasonal effect.
The Best Months to Sell: June and October
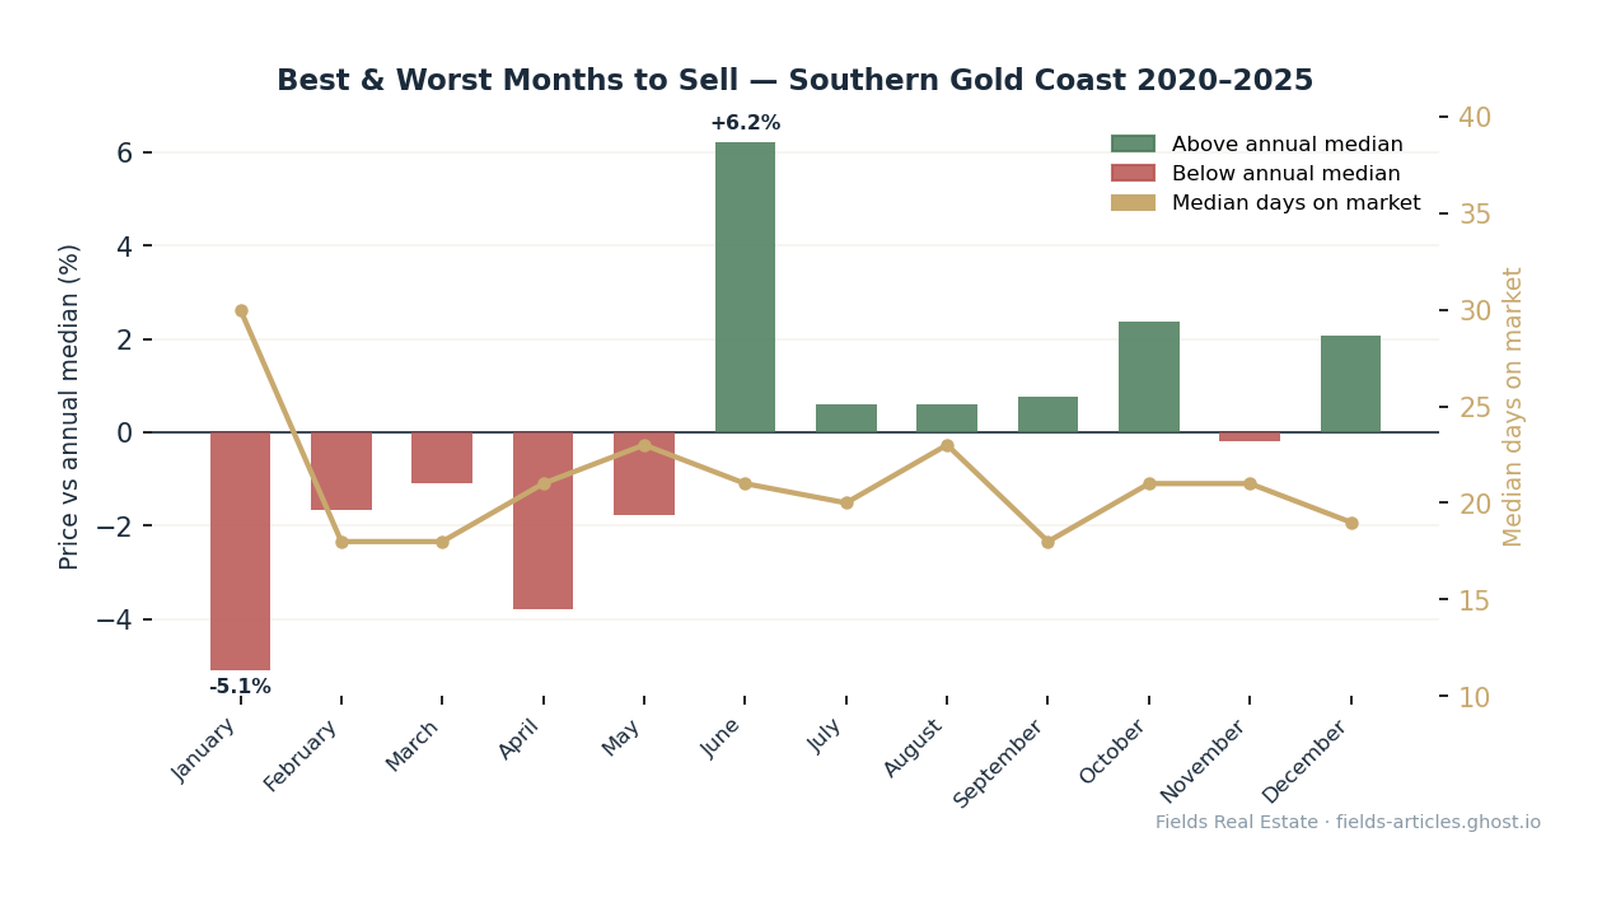
Looking at monthly performance relative to the annual median:
Month
Premium/discount vs annual median
Median DOM
January
-7.0%
23 days
February
-3.5%
16 days
March
+4.3%
16 days
April
flat
17 days
May
+0.9%
18 days
June
+4.6%
19.5 days
July
+0.5%
18 days
August
-2.6%
20 days
September
+0.4%
16 days
October
+4.3%
20 days
November
-4.3%
18 days
December
flat
18 days
June and October consistently command the highest prices — both running approximately 4–5% above the annual median. On a $1.3 million house, that's a $52,000–$65,000 difference purely from timing.
January is the worst month to list, running 7% below the annual median — and properties take 28% longer to sell (23 days vs 18 days for the rest of the year).
Why June Outperforms
The June premium is real but not guaranteed — it was strongly positive in 2021 (+12.8%), 2022 (+12.5%), and 2024 (+4.3%), but slightly negative in 2023 and 2025. The pattern holds in rising markets and moderates in flat ones.
The mechanism: June sits at the end of financial year, when buyers who've been watching the market for months consolidate their decisions. It's also post-Easter settlement season — many buyers who listed in March/April are now settled and re-entering the market with equity to deploy.
Combined: motivated buyers, lower competition from sellers (listing volumes in June are slightly below peak), and seasonal urgency (before the school holidays slow activity).
Why October Is Equally Strong
October is often overlooked in favour of "spring" generalisations. But the data is clear: October matches June for premium, driven by buyers who want to settle before Christmas school holidays lock down activity.
The October advantage over November is particularly stark: +4.3% in October versus -4.3% in November — an 8.6 percentage point swing in two consecutive months. The window closes fast.
The January Problem
January is the worst month to sell — not just in terms of price (7% below the annual median) but in terms of speed. Properties listed in January take 28% longer to sell, creating compounding problems: the longer a property sits, the more buyers assume there's something wrong.
The mechanism: January buyers are mostly casuals — people browsing over holidays without real urgency. Serious buyers are either away or waiting for the market to restart properly in February/March. Listing in January exposes you to your weakest buyer pool first, and a slow start can damage a campaign that might otherwise have succeeded.
The November Trap
November looks like spring on the calendar but performs like winter in the data: -4.3% below the annual median. The reason is buyer exhaustion — the serious spring buyers have already committed in October or earlier. By November, you're dealing with buyer decision fatigue and competition from properties that didn't sell in October now being relisted at lower prices.
If you're thinking about listing in late October, the data strongly supports getting your property to market before November.
What About "Spring Is Always Best"?
The conventional wisdom — spring (September–November) is the best time to sell — is partially supported but more nuanced in our market.
September is solid but not exceptional (+0.4% above median, 16-day DOM)
October is genuinely the strongest spring month
November underperforms — the spring effect is already over
The "spring" advice may have originated in Melbourne or Sydney markets where winter truly suppresses buyer activity. On the Gold Coast, mild winters mean January is the genuine low season, and the cycle plays out differently.
The DOM Signal: Speed Matters
Days on market tracks seasonality independently:
Fastest months: February, March, September (16 days median DOM)
Slowest: January (23 days), August, October (20 days)
The interesting anomaly: October sells at a premium but takes slightly longer. This is because premium-priced properties dominate October listings — buyers are motivated but the sale process at higher prices takes more time. It's not a warning sign.
Volume and Competition: When Do Other Sellers List?
Listing volumes peak in March and October and are lowest in December and January. This creates an important consideration:
March has strong prices and high buyer activity — but also the most competing listings
June has strong prices and lower seller competition — fewer properties competing for the same buyer pool
December/January has the fewest competing listings but also the weakest buyer pool
For maximising sale price rather than simply selling quickly, June is the best balance of buyer quality, price premium, and low competition from other sellers.
Practical Implications
If you're ready to sell now (March–April): You're in a reasonably strong period. March is historically 4.3% above the annual median. Don't delay into winter — prices moderate in July–August.
If you can wait 3–4 months: Target a June campaign. Listing in late May for a June campaign gives you the price premium with manageable competition.
If you're thinking about November: Don't. The data is clear — November underperforms both October (which precedes it) and even the flat months of the year.
If you're under pressure to sell in January: Manage expectations carefully. January properties take longer to sell and typically achieve 7% less than comparable properties sold in peak months. If you can delay to February or March, the data supports waiting.
The Real Variable: Your Property, Your Market
Seasonal patterns are real but they're tendencies, not guarantees. A well-presented, well-priced property in January will outperform a poorly marketed property in June. Market timing improves outcomes at the margin — it doesn't replace the fundamentals of presentation, marketing, and accurate pricing.
The practical advice: if you have flexibility on timing, lean toward June or October. If you don't have flexibility, focus energy on the things you can control — presentation, photography, the right agent, and a pricing strategy that reflects what the market is actually paying right now.
Summary Table
Timing
Recommendation
Best months
June, October, March
Good months
July, September, April/May
Avoid if possible
January, November
Neutral
February, August, December
Analysis based on 6,848 house sales across Robina, Varsity Lakes, and Burleigh Waters (2020–2025). Monthly prices indexed to annual median to strip out year-over-year market movement. All property types excluded except houses.
By Will Simpson, Fields Real Estate
Keep reading:Gold Coast market data — prices, supply and selling times, updated as new sales settle.
Disclaimer: The information in this article is for general informational purposes only and does not constitute financial, investment, or valuation advice. Fields Real Estate (Licence No. 4832972) makes no warranty as to the accuracy or currency of data published. Readers should conduct their own due diligence and seek independent professional advice before making any property or investment decision. Read our full disclaimer →
Licensed Queensland real estate agent, founder of Fields Real Estate and Lead Analyst at Fields Research. Covering Gold Coast market data, comparable sales analysis and suburb intelligence.
Where does your own home sit?
Fields keeps a record of every active listing and recent sale across the southern Gold Coast, and reads any address against the sales around it — the comparables, the range they support, and the method behind it. This analysis of the Gold Coast comes from the same database.