What do comparable sales say about your home?Your home vs recent sales
Enter your address to see the comparable sales around it. Free, no sign-up.Free comparable sales for your address.
🔍
Analyst4 March 2026·Updated 15 September 2026·3 min read
Robina Sales Volume Surges 111% as Supply Hits Record Low
Robina just flipped from one of the corridor's weakest-volume markets to positive territory in a single quarter. Based on 58 house sales in Q4 2025, the numbers are hard to ignore.
Robina just flipped from one of the corridor's weakest-volume markets to positive territory in a single quarter. Based on 58 house sales in Q4 2025, the numbers are hard to ignore.
What the Data Shows
Twelve months ago, Robina was running -43.4% below its prior 12-month sales baseline. That's a market where buyers had time, leverage, and options. By Q4 2025, that same measure had swung to +4.9% — a 111% reversal in relative volume across just one quarter, backed by 58 transactions. Across seven years of corridor data, a z-score of 29.31 on a single-quarter volume swing is statistically extreme. This isn't noise. Demand has genuinely re-entered the market.
What makes this more significant is where supply sits right now. Months of supply has fallen to just 1.7 — down 45.2% from 3.1 last quarter. Below two months is considered a strong seller's market by any standard measure. Fresh listings did tick up modestly, from 47 to 53 (up 12.8%), but that small rise in new supply hasn't absorbed the demand surge. The volume recovery is demand-led, not a flush of new stock hitting the market.
What This Means
The negotiating window that existed in Robina through 2024 and into early 2025 has closed. Buyers who held off — waiting for the market to bottom, or for distressed stock to emerge — are now competing against returning demand at the tightest supply point on record for this suburb. Median days on market currently sits at 23 days, and 100% of the 58 Q4 2025 transactions sold within 30 days. There is no slow-moving stock left to pick through.
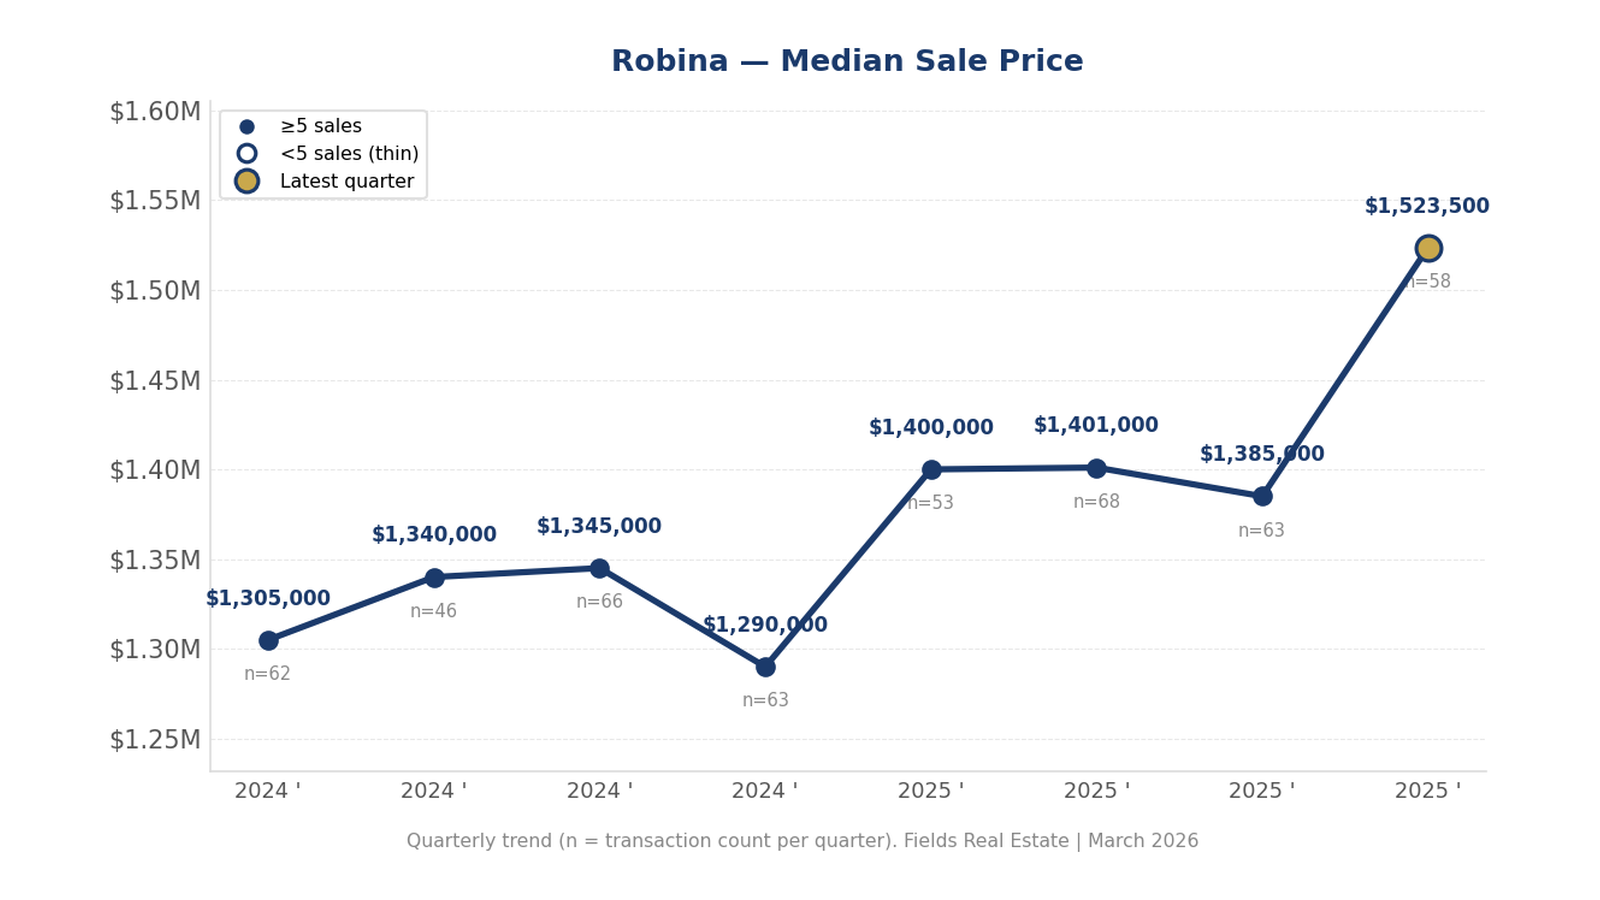
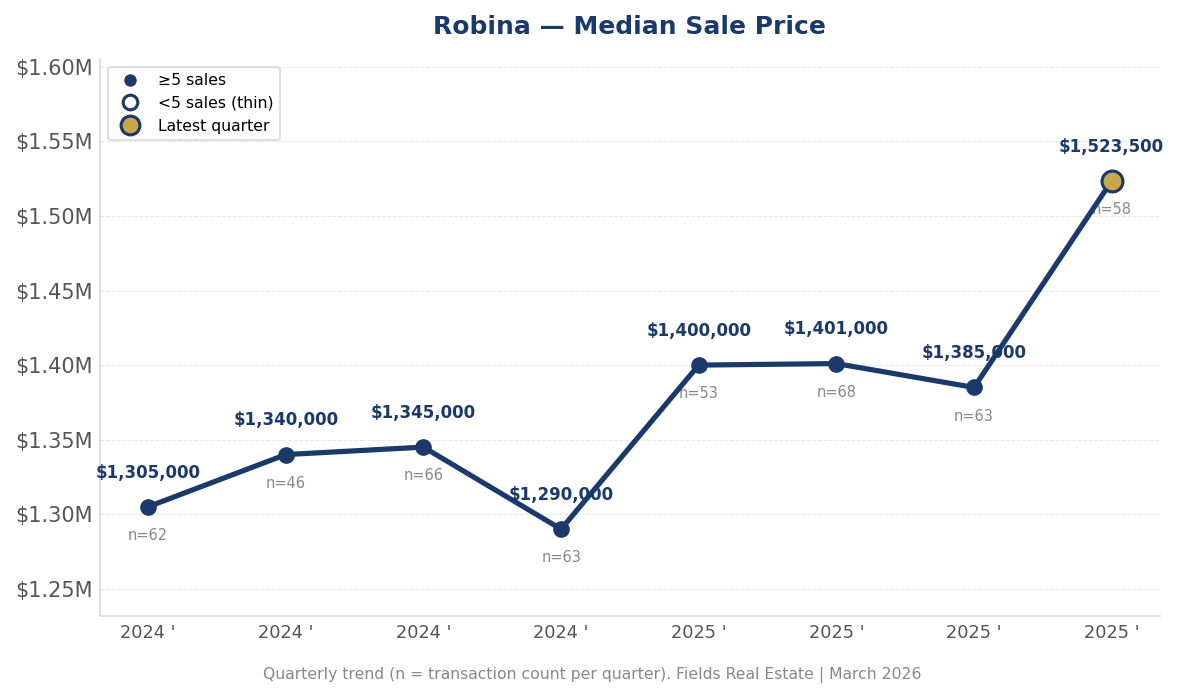
Price momentum is also accelerating. Quarterly price growth moved from +2.4% in Q3 2025 to +10.0% in Q4 2025, based on 58 sales. The rolling 12-month median currently sits at $1,430,000 across 213 sales — a more stable measure, showing +5.9% growth over the prior 12-month period. The quarterly same-period comparison (Q4 2024 vs Q4 2025) tells a sharper story: $1,290,000 to $1,523,500, a rise of +18.1% across comparable transaction sets of 63 and 58 sales respectively. The gap between the two figures reflects different time windows and sample compositions — both are real, and both point in the same direction.
For any buyer with Robina on their shortlist, the practical implication is straightforward: waiting for further clarity is unlikely to deliver a better entry point. With months of supply at 1.7 and volume momentum accelerating, the market is moving toward sellers. Pre-auction approaches on targeted properties give buyers a chance to transact before competitive pressure intensifies further.
The Bigger Picture
This isn't an isolated shift. Across the southern Gold Coast corridor, tightening supply has been a consistent theme — but the speed of Robina's reversal stands out. A -43.4% to +4.9% volume swing in one quarter is the kind of move that typically precedes sustained price compression in available stock. Varsity Lakes and Burleigh Waters have both seen months of supply tighten this cycle, but neither has recorded a volume acceleration of this magnitude in the same window.
Robina has changed footing. The data says so clearly.
Keep reading:Robina market data — prices, supply and selling times, updated as new sales settle.
Fields tracks these metrics weekly across the southern Gold Coast corridor. Follow us for the next update.
Licensed Queensland real estate agent, founder of Fields Real Estate and Lead Analyst at Fields Research. Covering Gold Coast market data, comparable sales analysis and suburb intelligence.
Where does your own home sit?
Fields keeps a record of every active listing and recent sale across the southern Gold Coast, and reads any address against the sales around it — the comparables, the range they support, and the method behind it. This analysis of the Gold Coast comes from the same database.