What do comparable sales say about your home?Your home vs recent sales
Enter your address to see the comparable sales around it. Free, no sign-up.Free comparable sales for your address.
🔍
Analyst1 April 2026·Updated 15 September 2026·3 min read
Robina Listings Jump 32% as Fast-Sale Rate Cools From Record Highs
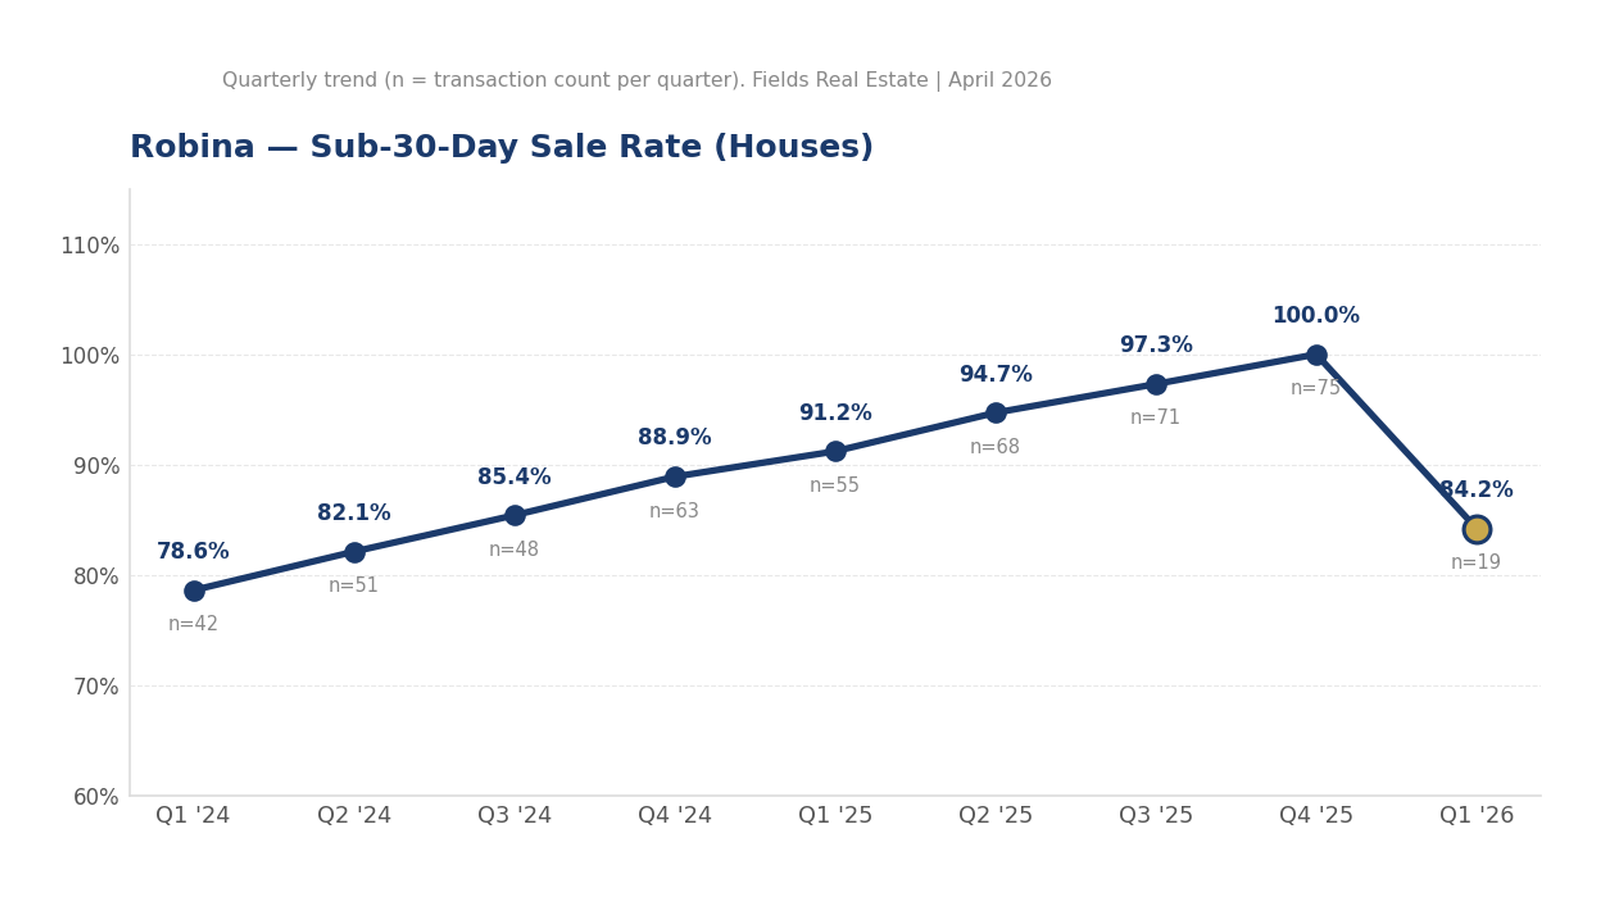
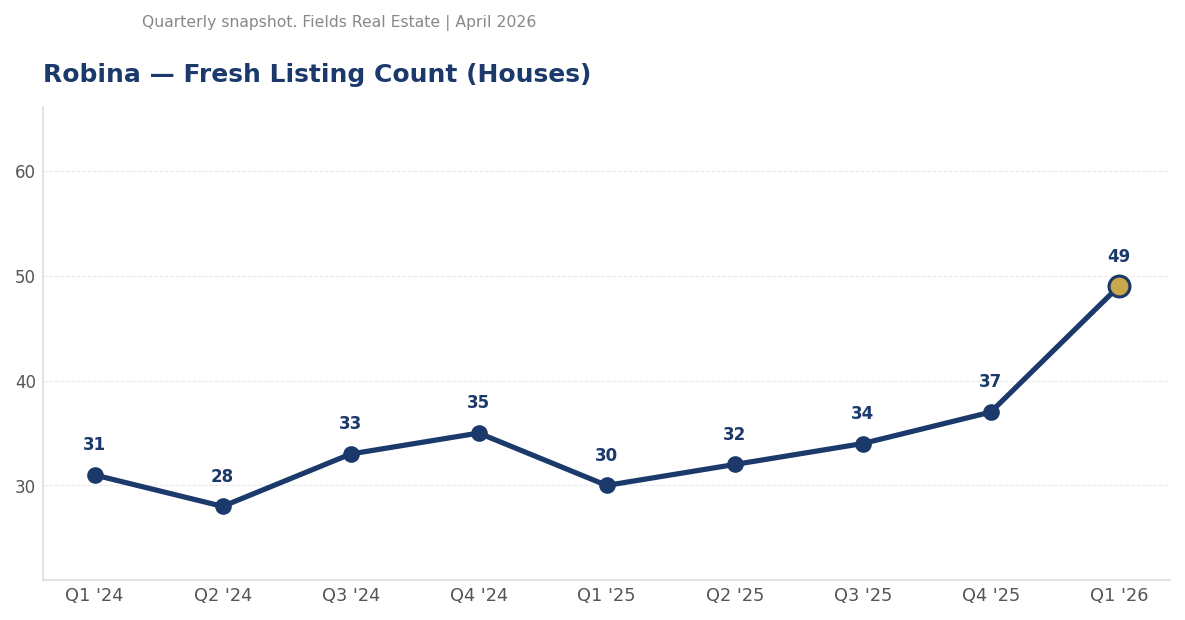
Fresh listings in Robina just hit 49 — the highest level in over a year — while the share of homes selling within 30 days has dropped from a perfect 100% to 84.2%. The data, backed by 75 house sales in Q4 2025, is the clearest statistical signal yet that Robina's exceptional seller's market is…
Fresh listings in Robina just hit 49 — the highest level in over a year — while the share of homes selling within 30 days has dropped from a perfect 100% to 84.2%. The data, backed by 75 house sales in Q4 2025, is the clearest statistical signal yet that Robina's exceptional seller's market is beginning to normalise.
What the Data Shows
For the past several quarters, Robina's listing pool was so thin and competition so fierce that virtually every home sold inside a month. That 100% sub-30-day rate was an outlier — and the conditions it created were extreme for buyers. Now, fresh listing count has moved from 37 to 49, a +32.4% jump that registers a z-score of 2.98 across 11 quarters of history. In plain terms: this is the largest supply increase we've measured in over two years. It is not noise.
The fast-sale rate cooling from 100% to 84.2% — a drop of 15.8 percentage points, based on 19 transactions so far in Q1 2026 — reinforces the directional shift. That said, 84.2% is still a fast market. Months of supply sits at 1.6, well below the 3-month threshold that defines a balanced market. The stale listings share has actually fallen from 14.0% to 10.9%, meaning quality, correctly priced stock is still clearing quickly. This is not a slowdown. It is a gear-change.
What This Means
For buyers, this is the first window of real choice Robina has offered in several quarters. When 100% of homes sold within 30 days, waiving due diligence wasn't caution — it was often the entry ticket. At 84.2%, there is now modest breathing room. Not infinite time, but enough to do the homework before signing.
For sellers, the data carries a more pointed message. Overpricing now carries genuine risk in a way it simply did not when every listing cleared regardless. With 10.9% of listings going stale, there is still a slim but real chance of joining that bucket — and homes that drift past 30 days lose negotiating leverage fast. Correct pricing remains the sharpest tool available.
On price: the rolling 12-month median for Robina houses sits at $1,442,500, based on 199 sales. That figure reflects +6.8% growth compared to the prior rolling 12 months — a more measured read than the quarterly comparison, which shows +15.9% (Q4 2024 at $1,290,000 across 63 sales vs. Q4 2025 at $1,495,000 across 75 sales). The gap between those two figures is large, and worth understanding: the quarterly comparison captures a particularly active segment of the calendar, while the rolling 12-month figure smooths across a broader, more representative pool of 199 transactions. Both are valid — they measure different windows.
The Bigger Picture
Across the southern Gold Coast corridor, Robina's +6.8% rolling 12-month price growth is comparatively moderate. Neighbouring Varsity Lakes is running at +17.2% — but that figure rests on a much thinner base of 53 sales, with considerably less liquidity than Robina's 357 trailing-12-month transactions. For investors weighing entry points, Robina's deeper market means the data is more reliable and single-sale anomalies are less likely to skew the read. The trade-off is lower short-term price acceleration. The offset is lower volatility.
Fields tracks these metrics weekly across the southern Gold Coast corridor. Follow us for the next update.
Keep reading:Robina market data — prices, supply and selling times, updated as new sales settle.
Disclaimer: The information in this article is for general informational purposes only and does not constitute financial, investment, or valuation advice. Fields Real Estate (Licence No. 4832972) makes no warranty as to the accuracy or currency of data published. Readers should conduct their own due diligence and seek independent professional advice before making any property or investment decision. Read our full disclaimer →
Licensed Queensland real estate agent, founder of Fields Real Estate and Lead Analyst at Fields Research. Covering Gold Coast market data, comparable sales analysis and suburb intelligence.
Where does your own home sit?
Fields keeps a record of every active listing and recent sale across the southern Gold Coast, and reads any address against the sales around it — the comparables, the range they support, and the method behind it. This analysis of the Gold Coast comes from the same database.