What do comparable sales say about your home?Your home vs recent sales
Enter your address to see the comparable sales around it. Free, no sign-up.Free comparable sales for your address.
🔍
Analyst10 September 2026·Updated 15 September 2026·7 min read
Renovated Homes Sell for More — but the Suburb Changes How Much
Fully renovated houses sold for more in Robina, Varsity Lakes and Burleigh Waters — but the premium varied sharply between suburbs. Across 578 sales, we also found no measurable premium for homes renovated only part-way. The market rewarded the completed result, not individual improvements.
Every seller with a dated kitchen eventually asks the same question: if we renovated before selling, would we get the money back?
We analysed 578 house sales across Robina, Varsity Lakes and Burleigh Waters. Two findings stood out. Fully renovated homes sold for substantially more — but the premium varied sharply by suburb. Homes renovated only part-way, meanwhile, sold for about the same as homes left in original condition.
Here is what the records show, and how we checked it.
First, a trap
The obvious way to test this is to work out what each home sold for per square metre of floor space, then compare renovated homes with original ones.
We did that first, and it says something odd: in Robina and Varsity Lakes, renovated homes appear to sell for less per square metre than untouched ones.
Odd — and wrong. Here’s the catch. Big homes always sell for less per square metre than small ones (a house twice the size doesn’t cost twice as much). And big homes are more likely to have been renovated. Stack those two facts together and renovated homes look like poor value per square metre even when buyers are paying good money for them. The comparison isn’t measuring renovation at all. It’s measuring house size.
So we compared like with like instead. Every renovated home was measured against unrenovated homes of similar size, on similar land, with the same number of bedrooms, selling around the same time, in the same suburb. It is the closest the real world offers to a fair comparison.
What a full renovation actually sold for
Suburb
Fully renovated homes sold for
On a typical house, that’s roughly
Burleigh Waters
16% to 23% more
$300,000 to $420,000
Robina
about 12% more
$175,000
Varsity Lakes
maybe 7% more — too imprecise to be sure
$93,000
“Typical house” here means the middle sale in our data — half sold for more, half for less: $1,845,000 in Burleigh Waters, $1,491,944 in Robina, $1,351,000 in Varsity Lakes.
These figures are estimated differences in sale price — not renovation profits. A $300,000 sale-price premium does not mean an owner made $300,000 by renovating, because the data does not show the cost of the work or what the same house would otherwise have sold for.
A note on those figures. No study of real sales can nail a premium to the decimal point — there’s always a margin around it, and the bars in the chart show exactly that: the dot is the best estimate, the bar is where the true premium very likely sits. Robina’s bar is fairly tight — very likely between 6% and 18%, with 12% the best estimate. Burleigh Waters sits confidently in positive territory too. Varsity Lakes had only 26 fully renovated sales, leaving the estimate too imprecise for a confident conclusion — which is why its bar is drawn faded and we say “maybe.”
The suburb difference itself was consistent: across all three comparison methods we used, Burleigh Waters’ estimated premium remained about 10 percentage points higher than Robina’s.
Is the premium bigger than the cost of the renovation? That’s the question, and sale records can’t answer it — they never show what an owner spent. What they show is the additional sale price associated with a fully renovated home. In Burleigh Waters, that figure is roughly twice Robina’s.
Partial renovations earned no measurable premium
This finding surprised us more than the suburb gap.
Our records grade each home’s condition from its sale photos — original, cosmetically updated, partially renovated, fully renovated. Across all three suburbs, we found no reliable price premium for homes in the middle grades compared with original homes. In price terms, they behaved much more like original homes than fully renovated ones. Every measurable premium, in every suburb, sat in one grade: fully renovated.
The market appears to pay for finished. The measurable premium emerged only when the entire home was renovated — new floors under an old kitchen, or one bathroom done and one dated, showed no detectable reward.
See the grading for yourself
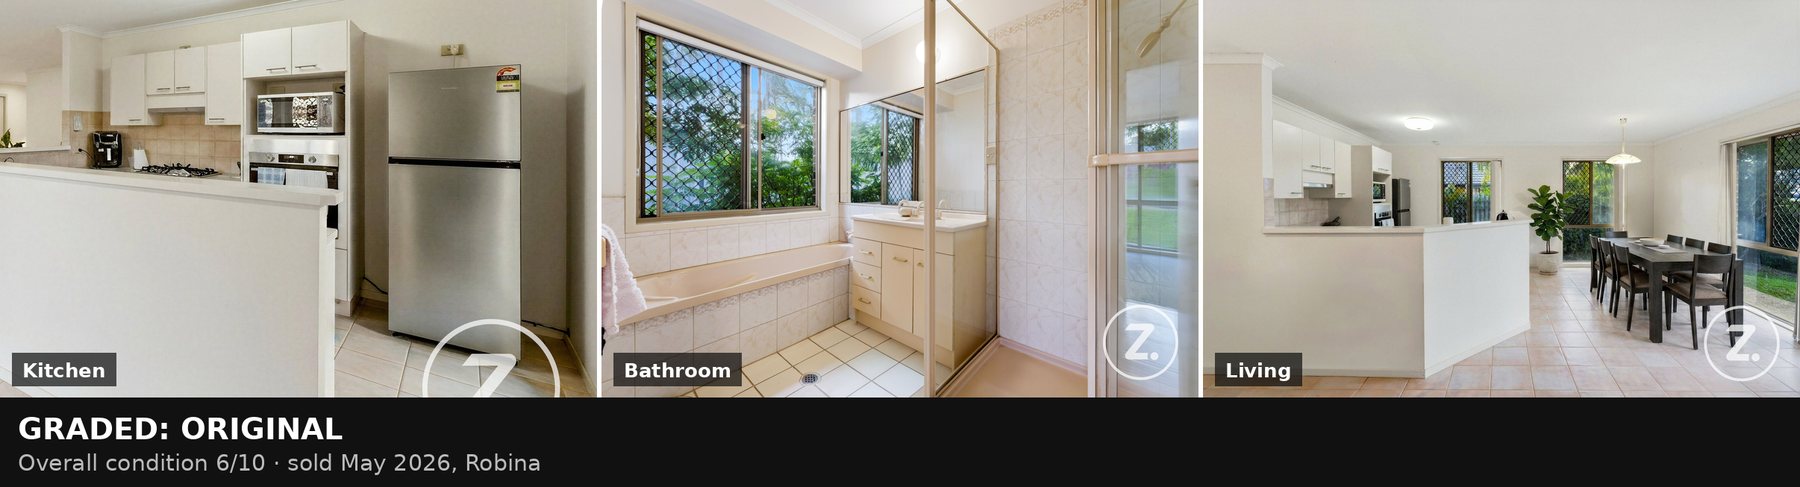
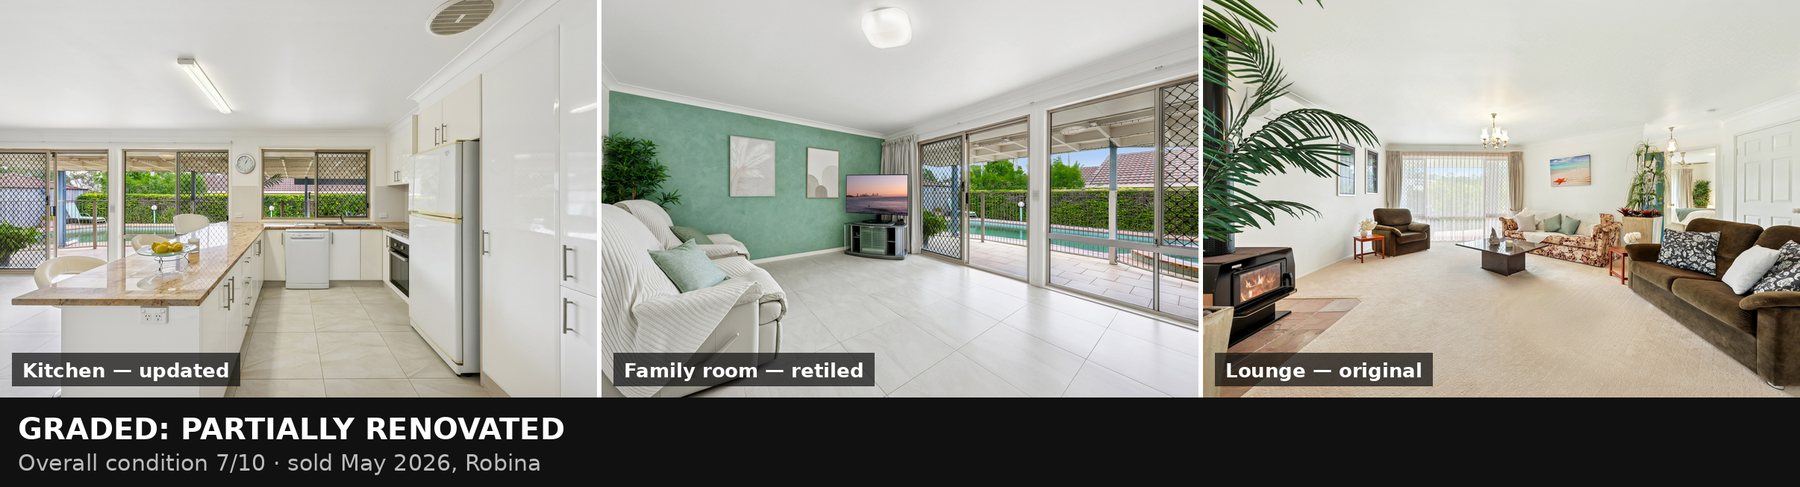
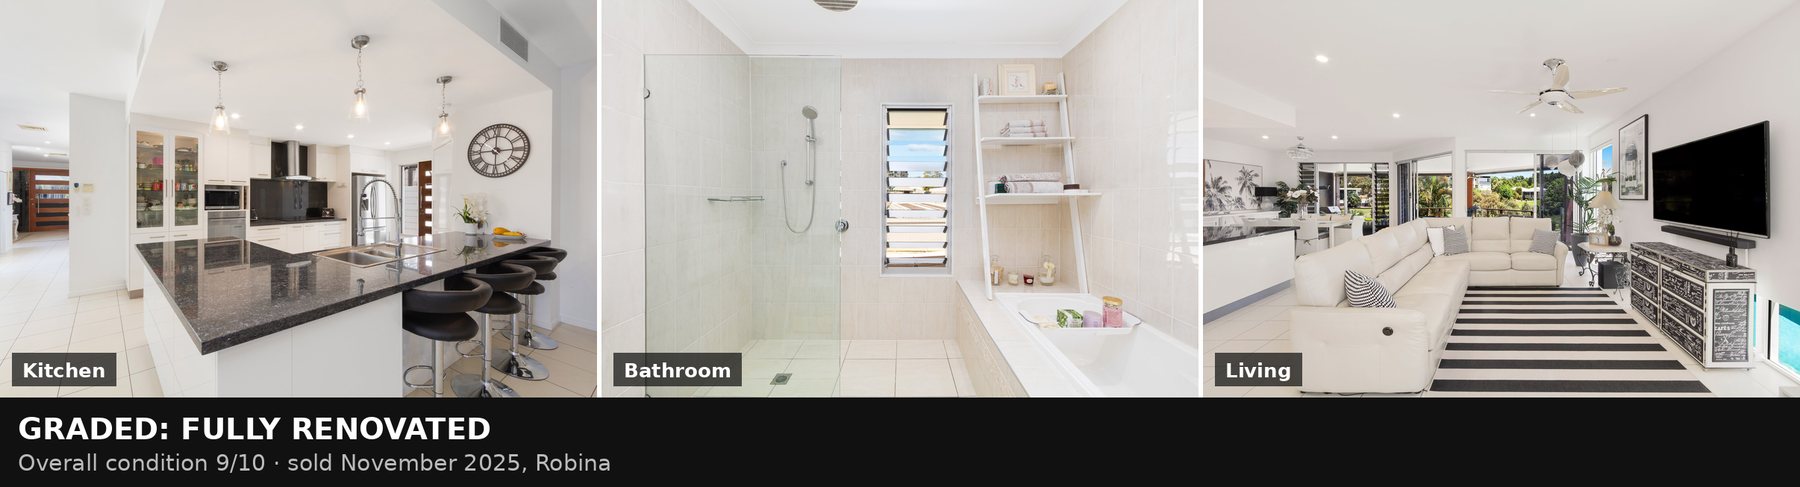
Fair question at this point: how good is an AI model at judging a home from photos? You can check its work. Below are three real Robina homes from the sales we studied, each shown across three rooms, with the grade our model gave the whole home.
One thing to know first: “original” describes whether the home has been substantially renovated — not whether it is clean, functional or well maintained. That is why an original home can still score reasonably on condition. The grades measure completeness of renovation; the 0–10 scores measure state of repair.
Original: everything works and the home is well kept — but the kitchen cabinetry, bathroom and finishes are as built. Sold May 2026.
Partially renovated — and you can see the “partial” in one glance: the kitchen has new stone benchtops and the family room new tiles, while the lounge keeps its original carpet and wood heater. The work stopped part-way. Sold May 2026.
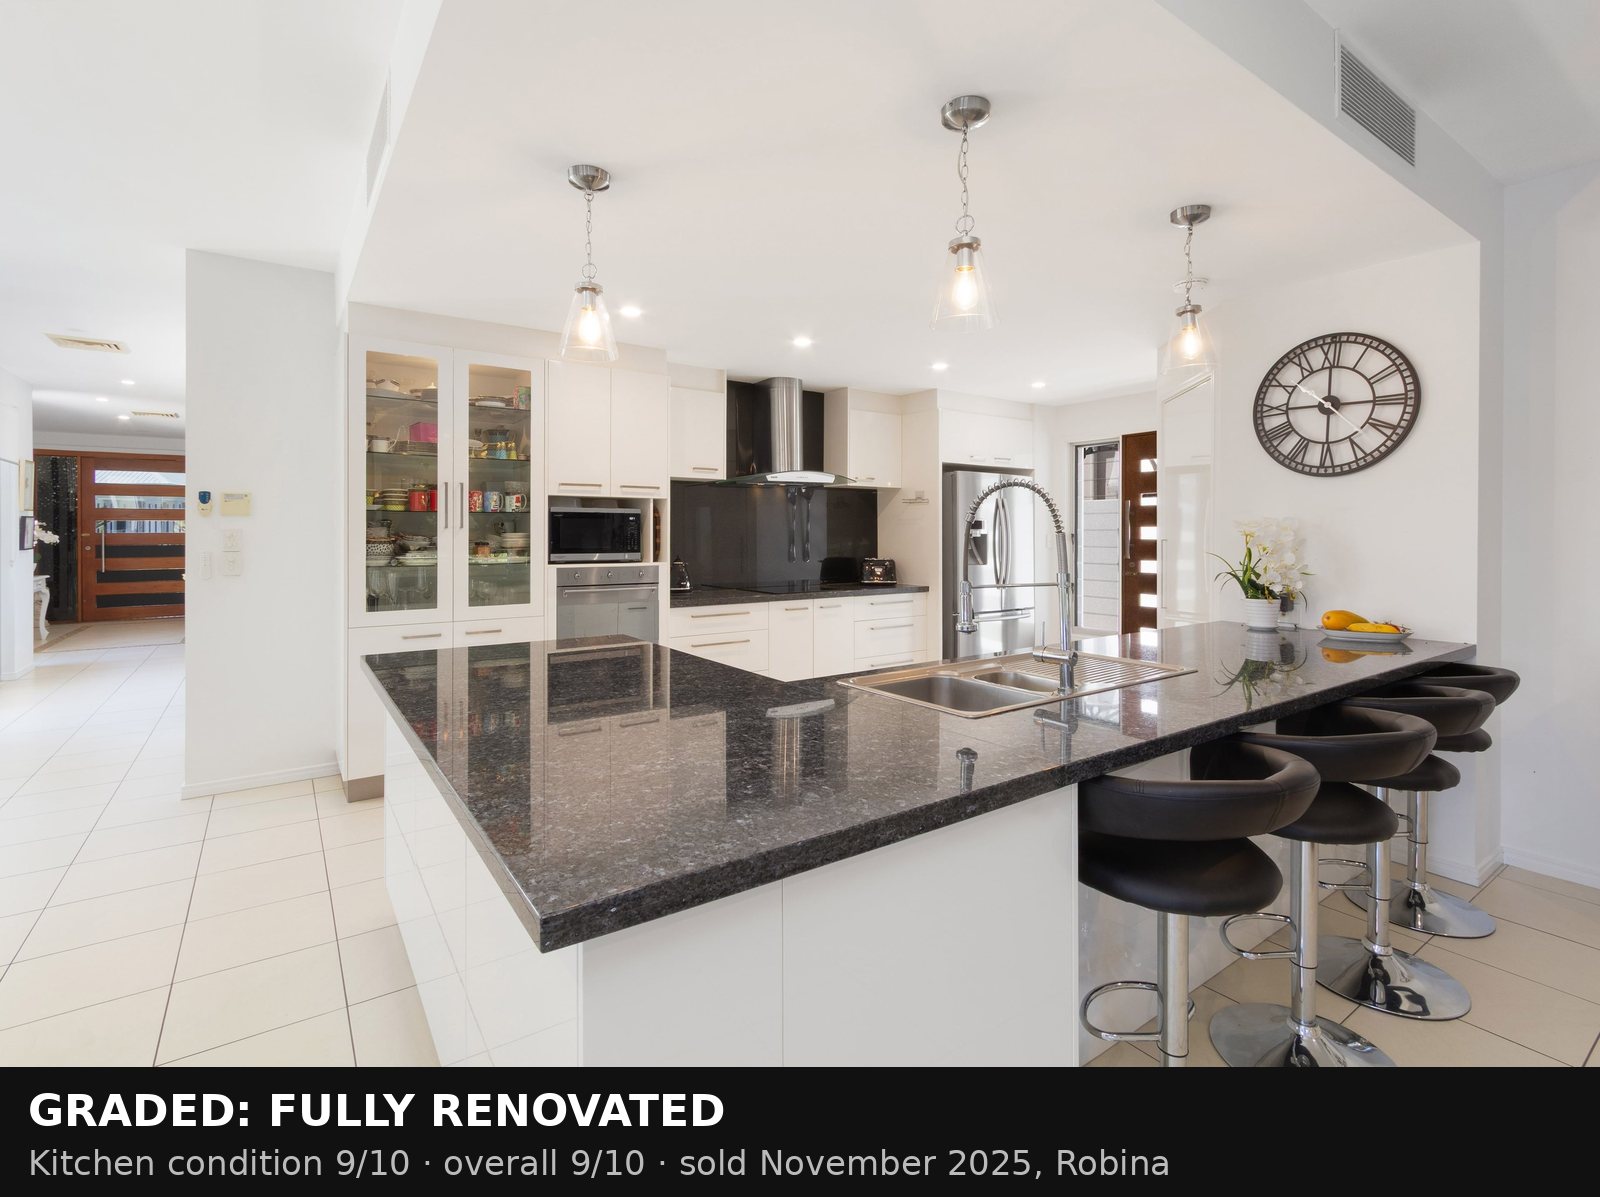
Fully renovated: stone island bench and pendant lighting in the kitchen, frameless glass and floor-to-ceiling tiles in the bathroom, nothing left from the original home. Sold November 2025.
Notice the middle home scored a solid 7 out of 10 for overall condition — genuinely good work where it was done — yet it still sold in a grade for which we found no measurable premium. Condition and completeness are different things, and the premium followed completeness.
No single room carried it
We also checked the rooms one at a time. Does a renovated kitchen, by itself, lift the price? A renovated bathroom? New floors?
We found no reliable premium for any one of them on its own. What moved the price was the overall finish of the whole home. Buyers in these suburbs responded to the complete picture, not to any one room in it.
Why might Burleigh Waters be different?
The sales records cannot tell us why buyers paid a larger renovation premium in Burleigh Waters, but the suburb’s upper price segment provides a clue.
Across 8,647 sales since 2015, homes selling above one-and-a-half times the suburb’s typical price became steadily more common in Burleigh Waters — from about 9 in every hundred sales before 2020 to about 14 in every hundred since 2024 — and that share held up even through the 2022–2023 interest-rate rises, the fastest tightening in a generation. Robina’s share stayed relatively stable, around 6 to 8 in a hundred, in every rate environment.
Each dot in the top panel is one of the 8,647 sales, priced against its suburb’s typical price that year. The lower panel counts the share above the 1.5× line. Year-by-year figures are noisier than the multi-year averages in the text — Burleigh Waters dipped in 2023 before its 2024–2026 surge. Hover or tap any year for the numbers.
That does not tell us whether these buyers were paying cash, borrowing less, earning more or simply prioritising Burleigh Waters more highly. But it does show the suburb’s premium segment remained unusually resilient as borrowing costs rose. One possible explanation is that more buyers at this end of the Burleigh Waters market have both the means and the preference to pay for a completed home rather than manage a renovation themselves. The sales records cannot prove that motivation — but it is consistent with the larger renovation premium we observed.
What this data doesn’t say
Worth being upfront about four things. These figures are about sale prices, not profits — nothing here shows what any renovation cost. Homes that get fully renovated may be better homes to begin with, so some of the premium likely belongs to the house, not the work. Condition was graded from sale photographs, which isn’t perfect — random grading mistakes would generally blur the difference between groups and pull the estimated premiums toward zero, although systematic grading errors could still affect the results. And waterfront homes, a market of their own, were left out entirely.
The conclusion here is not advice to renovate. It is that buyers distinguished sharply between a home that was completely finished and one where the work had merely begun — and the amount they paid for that difference depended heavily on the suburb.
Keep reading:Gold Coast market data — prices, supply and selling times, updated as new sales settle.
How we did this. Fields analysis of 578 house sales in Robina, Varsity Lakes and Burleigh Waters (24 months to September 2026), each home’s renovation state classified from its listing photography. We estimated the premium three independent ways: a like-for-like comparison within size brackets; a statistical model holding floor area, land size, bedrooms, bathrooms, water proximity and quarter of sale constant; and a matched-pairs test putting each fully renovated sale beside its closest unrenovated twins. All three pointed the same way. Suburb history: 8,647 house sale records, 2015–2026. Waterfront properties excluded throughout.
Licensed Queensland real estate agent, founder of Fields Real Estate and Lead Analyst at Fields Research. Covering Gold Coast market data, comparable sales analysis and suburb intelligence.
Where does your own home sit?
Fields keeps a record of every active listing and recent sale across the southern Gold Coast, and reads any address against the sales around it — the comparables, the range they support, and the method behind it. This analysis of the Gold Coast comes from the same database.