The Reserve Bank raised the cash rate by 0.25 percentage points to 4.60% on Tuesday 29 September. It is the fourth increase this year, after February, March and May, and it takes the cash rate a full percentage point above where it started 2026 (3.60%). The decision was unanimous.
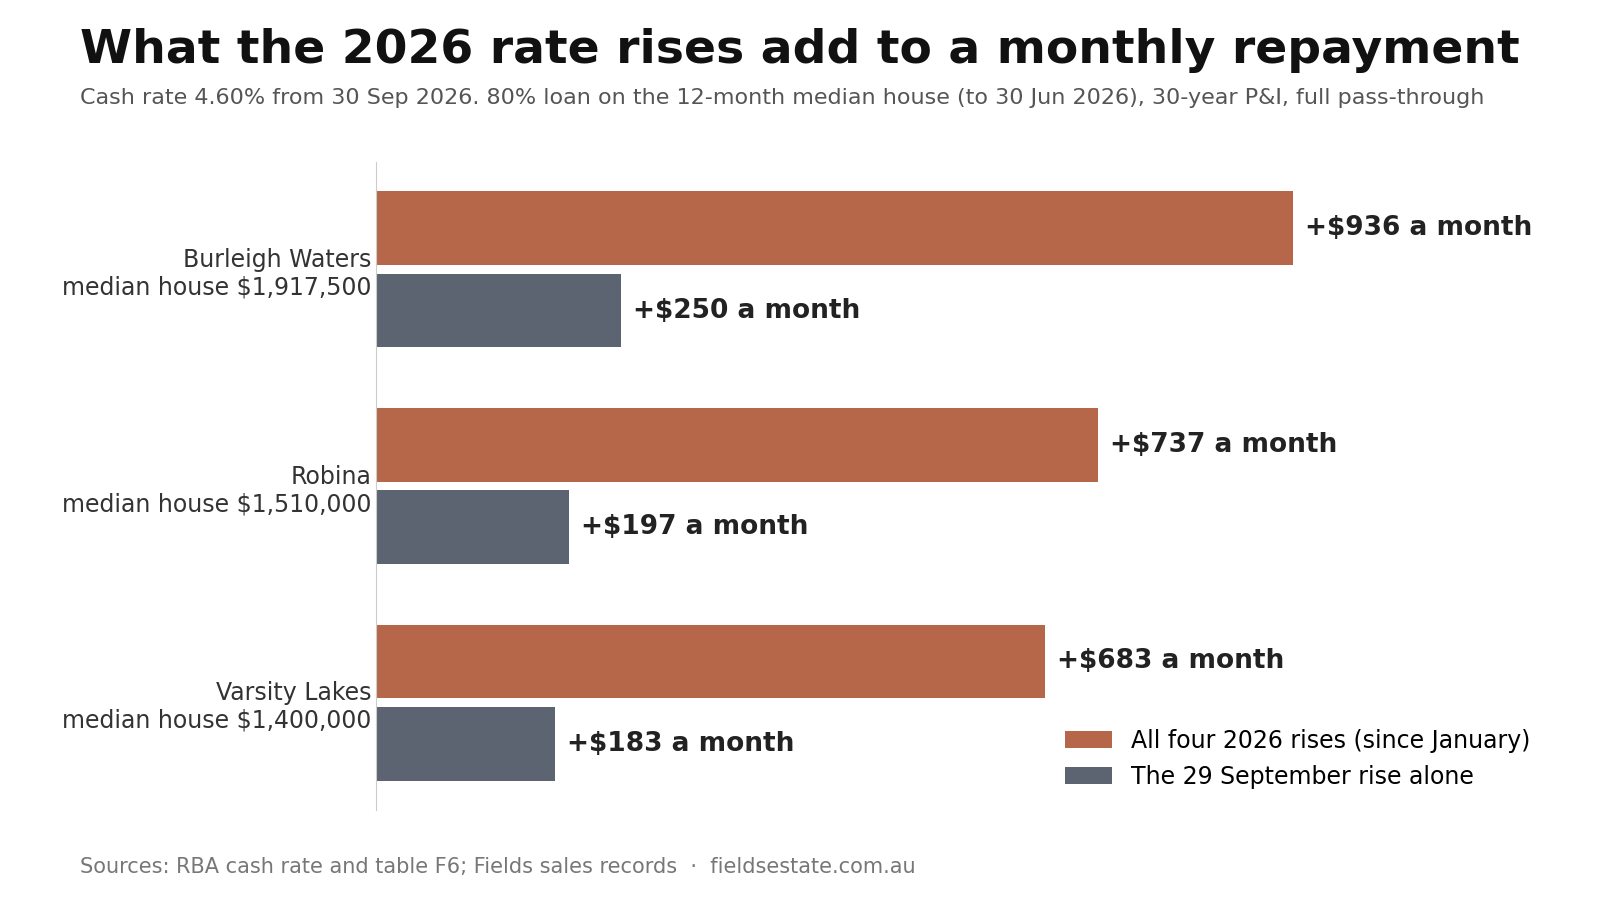
On the median house in our three suburbs, and on the loan assumptions below, this rise alone adds between $183 and $250 a month to repayments. Across the full run of 2026 increases, the addition is between $683 and $936 a month.
What the Reserve Bank said
The Board’s reasons were inflation, energy prices and capacity. Its statement said that “inflation remains elevated and some of the upside risks flagged in August are materialising”, and that “the conflict in the Middle East has broadened and global energy prices are now much higher than had been assumed in the August forecasts.”
Housing appeared twice. The Board noted that “housing prices have fallen in most capital cities and new housing loans have declined noticeably”, and it listed “the economic effects of the downturn in the housing market” among the uncertainties in its outlook.
On what comes next, the Board said it “will continue to do what it considers necessary to bring inflation sustainably back to target, including increasing the cash rate target further if needed.” It gave no timetable. Its next decision is due on 3 November 2026.
What it adds to a repayment
Suburb
Median house (12 months to 30 June 2026)
Loan at 80%
Monthly repayment before this rise
After this rise
Change from this rise
Change since January 2026
Robina
$1,510,000
$1,208,000
$7,399
$7,596
+$197
+$737
Varsity Lakes
$1,400,000
$1,120,000
$6,860
$7,042
+$183
+$683
Burleigh Waters
$1,917,500
$1,534,000
$9,395
$9,646
+$250
+$936
Over a year, the 2026 increases add $8,198 to repayments on the Varsity Lakes median, $8,842 on the Robina median and $11,228 on the Burleigh Waters median.
How these are calculated. The loan is 80% of the rolling 12-month median house price in Fields sales records, repaid principal and interest over 30 years. “Before” uses 6.20%, the Reserve Bank’s latest published average variable rate on new owner-occupier loans (RBA table F6, July 2026). “After” assumes lenders pass the full 0.25 points on, giving 6.45%. Individual lenders set their own rates and timing. “Since January” compares against 5.50%, the same F6 series in January 2026. These are repayments on a median-priced purchase with a 20% deposit, not the repayment on any particular household’s loan.
Where our three suburbs sit
Median prices are higher than a year ago, but homes are taking longer to sell. Those two things don’t contradict each other; they measure different stages of the same market.
Median house prices, 12 months to 30 June 2026, against the 12 months before:
Robina: $1,510,000 (315 sales), against $1,380,000.
Varsity Lakes: $1,400,000 (130 sales), against $1,232,500.
Burleigh Waters: $1,917,500 (216 sales), against $1,760,000.
Each of these medians carries a margin of about 3% to 3.5% either way.
Time to sell (median days on market, houses):
Suburb
June quarter 2025
June quarter 2026
September quarter 2026, sales recorded so far
Robina
18.5 days
31 days
45.5 days (36 sales)
Varsity Lakes
21 days
16 days
36.5 days (16 sales)
Burleigh Waters
30 days
28 days
41.5 days (32 sales)
The September quarter rests on a small number of sales and will change as late settlements are recorded. A median built on 16 to 36 sales can move several days on a single result. The direction is the same in all three suburbs, though, and it matches the wider Gold Coast: across the city, the three-month median days on market has risen from 26 days at the start of the year to 40 days in August.
Why the rate matters more at these prices
Across the Gold Coast, the repayment on a median house as a share of median household income reached 81% in the June quarter. That is above the previous high of 74% in the September quarter of 2024. The cash rate in mid-2026 (4.35%) was the same as in late 2023, but the median house cost more, so the same rate produced a larger repayment: $7,023 a month in June 2026 against $5,470 in late 2023. This measure is a yardstick for how stretched the typical purchase is, not a lending test, and it does not describe what any individual household can borrow.
Each 0.25-point move now shifts the repayment on a southern Gold Coast median house by roughly $180 to $250 a month, in either direction.
Three readings that show how buyers are responding
New housing lending. Of the nine indicators we have tested against Gold Coast price momentum since 2008, new housing lending in Queensland has the strongest lead, about four quarters. Growth in new lending has slowed from 20.2% a year in the December quarter of 2025 to 16.6% in the March quarter and 10.0% in the June quarter of 2026. Lending is still growing, but at half the pace of six months earlier. The ABS publishes this series quarterly. The next reading, for the September quarter, is due on 11 November 2026. It covers July to September, so it will show borrowing in the lead-up to this rise, not the response to it. The first quarter to reflect the new rate in full is the December quarter, due on 10 February 2027.
Selling times, by price band. Across the Gold Coast, in the 90 days to 22 September, houses took longer to sell than a year earlier in every price band:
Price band (houses)
Median days on market, 90 days to 22 Sep 2026
A year earlier
Under $1,000,000
38 days (109 sales)
20 days
$1,000,000 to $2,000,000
39 days (447 sales)
29 days
$2,000,000 to $3,000,000
53 days (101 sales)
43 days
$3,000,000 to $5,000,000
62 days (25 sales)
34.5 days
The slowest campaigns are at the top. Houses between $3,000,000 and $5,000,000 now take 62 days, close to twice as long as a year earlier, and $2,000,000 to $3,000,000 houses take 53 days. The $1,000,000 to $2,000,000 band, where most Gold Coast houses now sell (447 of the 682 sales in the table), has lengthened by 10 days. The top band rests on 25 sales, so its figure is the least certain. It matches the pattern in prices, though: premium canal and central suburbs are falling the most, while mid-priced suburbs are flat. Reserve Bank research has found that prices in expensive, high-income, investor-heavy areas are the most sensitive to interest rates (He and La Cava, 2020).
Auction clearance. The Gold Coast sells mostly by private treaty, so the closest auction reading is Brisbane. On a four-week basis, Brisbane’s clearance rate fell from about 35% in late 2025 to 13.7% in late July 2026, and has since recovered to 17.6% in the week to 20 September. Our testing found clearance rates have not led Gold Coast prices. They are best read as a same-week gauge of buyer confidence, and the first few weeks after this rise will show whether the recent recovery holds.
What the last rate cycle showed
The 2022–23 cycle is the closest comparison in our data. The Reserve Bank began raising in May 2022. Gold Coast house selling times rose from 25 days to 36 days by January 2023, when the cash rate had reached 3.10%. The Gold Coast median dipped 1.8% between the December and March quarters.
Then selling times fell back to 28–29 days by mid-2023, while the cash rate kept rising, to 4.10% in June and 4.35% in November. The median resumed rising from the June quarter of 2023. In that cycle, the market’s response came early and then settled while rates were still going up.
Three things differ this time:
The repayment burden is higher: 81% of median household income, against 60% in late 2022.
Selling times have responded faster: a 14-day rise after 0.75 points of increases this year, against an 11-day rise after about 3 points in 2022.
National conditions are weaker: Cotality reports that Sydney values are 8.6% below their February peak, a marginally deeper fall than at the same stage of the 2022–23 downturn, and that 97% of capital city suburbs fell in value over the three months to September. Its estimate of home sales over those three months is 19.1% lower than a year earlier and 13.3% below the previous five-year average. Sales volumes in Brisbane, Sydney and Perth are each down more than 20% on a year ago.
In its September report, Cotality also noted that lower-priced housing is “becoming less insulated” as the downturn broadens.
Scenarios the data can distinguish
None of these is a forecast. Each describes what the indicators above would look like if a particular explanation is right.
If the buyers most sensitive to rates have already stepped back, those still buying are less exposed to further rises. That is the pattern of 2023. The data would show selling times levelling out near current levels over the December quarter, lending growth staying positive and the Brisbane clearance recovery holding.
If rate pressure is still working through, more buyers would be stepping back with each rise. Selling times would keep lengthening beyond 40 days, lending growth would keep slowing toward zero and clearance rates would turn down again. Historically, a slowdown in lending has shown up in Gold Coast price momentum around a year later.
If the slowdown spreads from the top end into the middle, selling times in the $1,000,000 to $2,000,000 band would start lengthening at the pace of the bands above it, and price falls would spread from premium suburbs into the mid-priced ones that are flat today. If it stays at the top, the middle of the market would hold its current pace.
Where the readings sit today. The data doesn’t yet point clearly to one of these. Two readings lean towards the first scenario: lending is still growing, and Brisbane’s clearance rate has recovered from its July low. One leans towards the second: selling times are still lengthening. The December quarter readings are the next point at which they can be told apart.
Nationally, fewer homes are selling. Cotality estimates home sales over the three months to September were 19.1% lower than a year earlier. On its own that can’t separate the scenarios, because it can mean fewer buyers, fewer sellers, or both.
Dates to watch
Late October: the ABS inflation release. The Board has tied its next moves to that data.
3 November: the Board’s next decision.
11 November: the ABS new-lending figures for the September quarter. This is the strongest leading indicator we track, and the first reading since June.
10 February 2027: new-lending figures for the December quarter, the first full quarter at the new rate.
December quarter: days on market in our own data. September’s figures rest on small samples in each suburb, and this is the clearest check on which scenario is playing out.
Sources: Reserve Bank of Australia, Statement by the Monetary Policy Board, 29 September 2026 (media release 2026-27); RBA statistical tables F1 (cash rate) and F6 (lending rates); ABS Lending Indicators (new housing lending, Queensland); SQM Research auction clearance (Brisbane, four-week volume-weighted, combined property types); Cotality Home Value Index, October 2026 (September data) and September 2026; Fields sales records for Robina, Varsity Lakes and Burleigh Waters (houses, deduplicated); Fields Gold Coast composite median; ABS Census 2021 median household income, indexed. Limitations: our sales records capture most but not all sales, so we don’t report sales volumes here; recent quarters rest on fewer recorded sales and are revised as settlements arrive. Repayment figures are illustrative calculations on the stated assumptions. This article is general information, not financial advice.
Licensed Queensland real estate agent, founder of Fields Real Estate and Lead Analyst at Fields Research. Covering Gold Coast market data, comparable sales analysis and suburb intelligence.
Where does your own home sit?
Fields keeps a record of every active listing and recent sale across the southern Gold Coast, and reads any address against the sales around it — the comparables, the range they support, and the method behind it. This analysis of the Gold Coast comes from the same database.