What do comparable sales say about your home?Your home vs recent sales
Enter your address to see the comparable sales around it. Free, no sign-up.Free comparable sales for your address.
🔍
Analyst11 March 2026·Updated 15 September 2026·7 min read
What Your Land Is Actually Worth Per Square Metre — Robina, Varsity Lakes, Burleigh Waters
Land size is one of the most discussed but least understood value drivers in residential property. We analysed every house sale in Robina, Varsity Lakes, and Burleigh Waters from 2015 to 2025 to quantify what each square metre is actually worth.
Land size is one of the most discussed but least understood value drivers in residential property. Buyers ask "is bigger always better?" Sellers ask "how much is my extra land worth?" We analysed every house sale in our three target suburbs from 2015 to 2025 to give you precise, data-backed answers.
The Core Question
When two similar houses in the same suburb sell at different prices, the most common explanation is land size. But how much is each square metre actually worth? And does land value per sqm stay constant as lot size grows — or does it diminish?
The answers matter enormously for:
- Buyers deciding whether to pay a premium for a larger block
- Sellers benchmarking whether their land size is an asset or a liability
- Anyone trying to understand why one house sold for $150,000 more than a comparable one nearby
What We Measured
Dataset:
- House sales in Robina, Varsity Lakes, and Burleigh Waters, 2015–2025
- Filtered to lots between 200–2,000 sqm (excludes acreage, which has different pricing dynamics)
- Land value per sqm calculated as: total sale price ÷ lot size in sqm
- Marginal land value calculated using linear regression across 400–1,000 sqm lots
Current Land Value Per Square Metre (2023–2025)
Robina
Lot size
Median sale price
Land $/sqm
Transactions
Under 400 sqm
$976,000
$2,995/sqm
62
400–500 sqm
$1,156,000
$2,473/sqm
184
500–600 sqm
$1,270,000
$2,355/sqm
120
600–700 sqm
$1,420,000
$2,166/sqm
74
700–800 sqm
$1,414,000
$1,880/sqm
200
800–1,000 sqm
$1,452,000
$1,698/sqm
294
1,000–1,500 sqm
$1,648,000
$1,566/sqm
58
Key insight: The land rate per sqm actually decreases as lots get larger. A <400 sqm lot costs ~$2,995/sqm while a 1,000–1,500 sqm lot costs $1,566/sqm. Buyers don't pay proportionally for extra land — the marginal value of each additional square metre falls as lots grow.
Varsity Lakes
Lot size
Median sale price
Land $/sqm
Transactions
Under 400 sqm
$1,070,000
$2,971/sqm
142
400–500 sqm
$1,100,000
$2,611/sqm
202
500–600 sqm
$1,303,000
$2,343/sqm
68
600–700 sqm
$1,320,000
$2,019/sqm
96
700–800 sqm
$1,270,000
$1,724/sqm
42
800–1,000 sqm
$1,483,000
$1,654/sqm
24
1,000–1,500 sqm
$1,600,000
$1,468/sqm
8
Burleigh Waters
Lot size
Median sale price
Land $/sqm
Transactions
Under 400 sqm
$1,114,000
$2,792/sqm
28
400–500 sqm
$1,240,000
$2,900/sqm
176
500–600 sqm
$1,563,000
$2,890/sqm
60
600–700 sqm
$1,605,000
$2,520/sqm
524
700–800 sqm
$1,769,000
$2,384/sqm
134
800–1,000 sqm
$2,225,000
$2,634/sqm
198
Burleigh Waters anomaly: The land $/sqm curve in Burleigh Waters is less predictable than Robina/Varsity Lakes. Lots above 800 sqm command a premium rate ($2,634/sqm) — higher than the 600–800 sqm range. This reflects genuine scarcity: large lots in Burleigh Waters are rare and attract a size premium that doesn't exist in the other suburbs.
The Marginal Value of 100 Square Metres
Using regression across the 400–1,000 sqm range (the most common lot sizes), the data reveals what an extra 100 sqm of land is actually worth in each suburb:
Suburb
Value of +100 sqm of land
Robina
+$91,600
Varsity Lakes
+$85,400
Burleigh Waters
+$234,500
This is the number to use when comparing two similar properties. If you're deciding between a 600 sqm and a 700 sqm lot in Robina and the larger property is priced $100,000 more — that's data-supported. If it's $200,000 more, you're being asked to pay twice the market value of the land difference.
The Burleigh Waters figure ($234,500 per 100 sqm) is substantially higher because Burleigh Waters land is genuinely scarce. The suburb is largely built out, larger lots rarely come to market, and buyers compete aggressively for them.
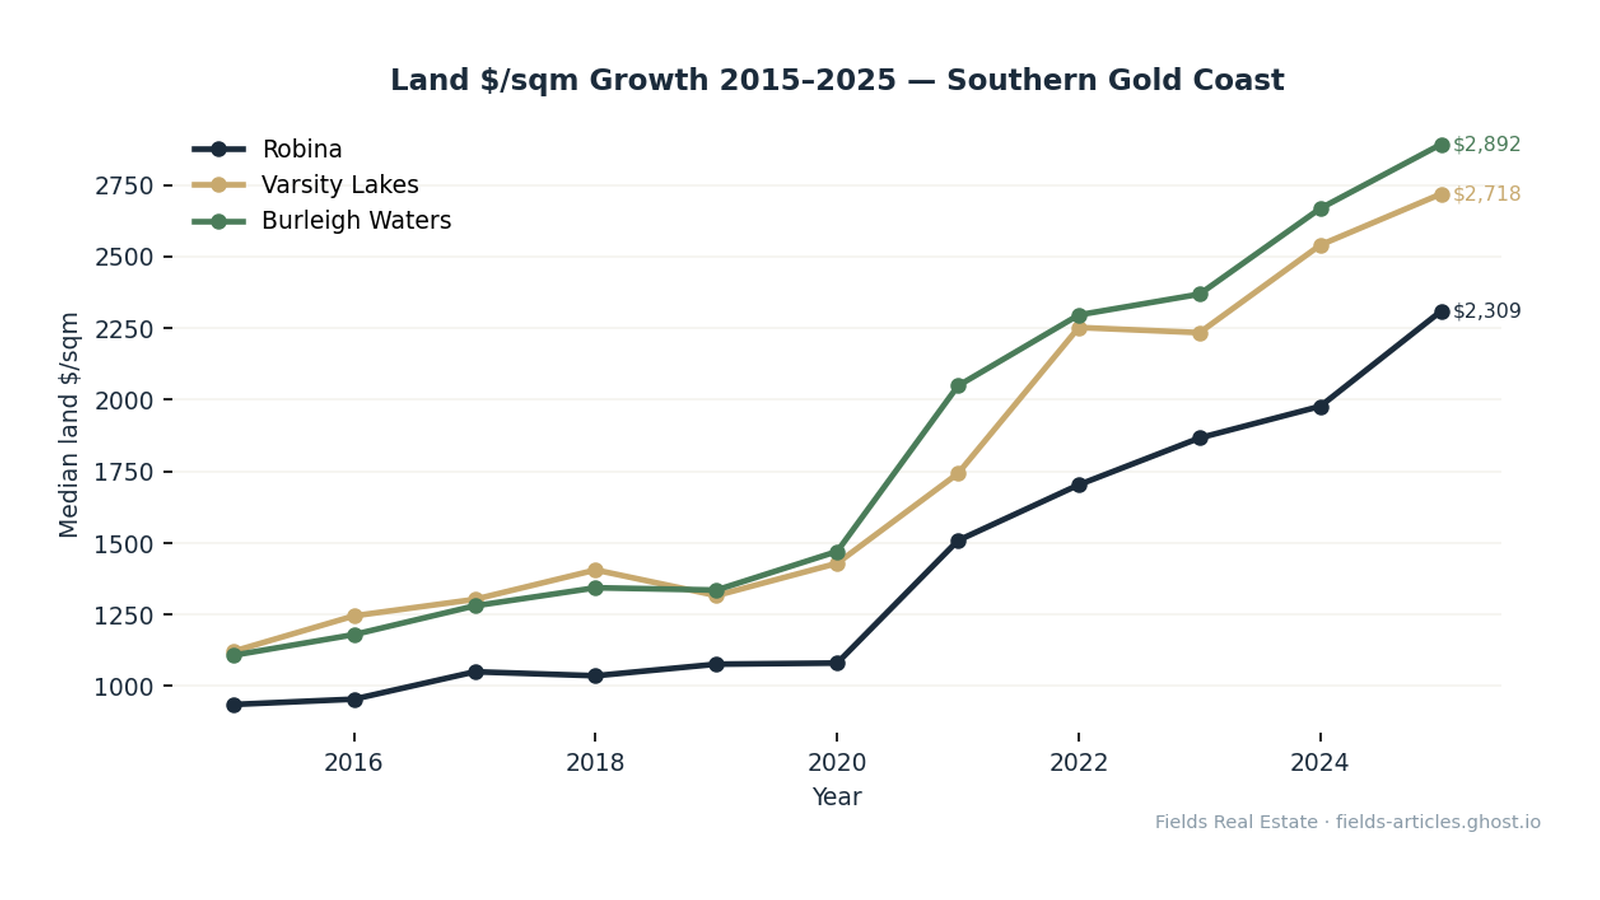
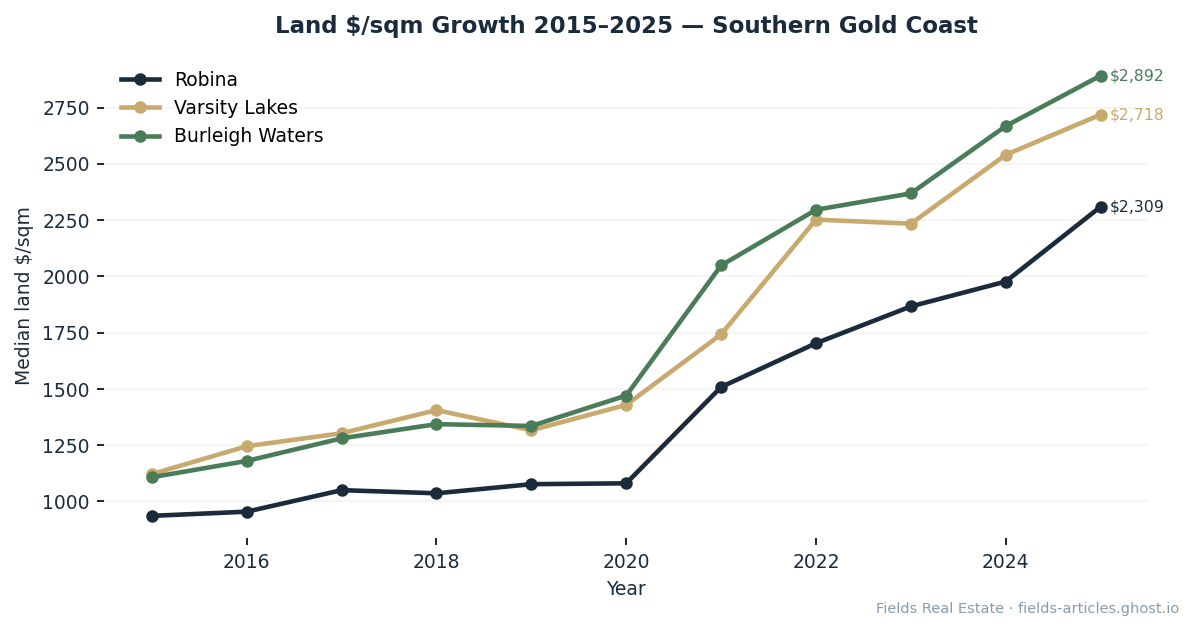
How Land Value Has Changed: 2015 vs 2025
The appreciation in land value has been remarkable — but uneven across suburbs.
Robina: Land $/sqm over time
Year
Median land $/sqm
Median price
2015
$935/sqm
$600,000
2019
$1,076/sqm
$693,000
2021
$1,508/sqm
$986,000
2023
$1,866/sqm
$1,180,000
2025
$2,309/sqm
$1,489,000
10-year change: Land in Robina went from $935/sqm to $2,309/sqm — a 147% increase. The property price increase over the same period was 148%. Land appreciation has kept pace almost exactly with total property appreciation — meaning the dwelling component hasn't added meaningful value beyond land.
Varsity Lakes: Land $/sqm over time
Year
Median land $/sqm
Median price
2015
$1,121/sqm
$548,000
2019
$1,316/sqm
$632,000
2021
$1,742/sqm
$860,000
2023
$2,234/sqm
$1,011,000
2025
$2,718/sqm
$1,323,000
Varsity Lakes started with a higher land $/sqm rate (reflecting smaller typical lot sizes) and has maintained a compressed land value curve throughout.
Burleigh Waters: Land $/sqm over time
Year
Median land $/sqm
Median price
2015
$1,107/sqm
$685,000
2019
$1,335/sqm
$845,000
2021
$2,048/sqm
$1,310,000
2023
$2,368/sqm
$1,500,000
2025
$2,892/sqm
$1,772,000
Burleigh Waters has seen the steepest land $/sqm increase in absolute terms — rising from $1,107 to $2,892 over 10 years (161% increase, vs 159% for total prices).
What This Tells Us About Suburb Fundamentals
The fact that land $/sqm growth has tracked total price growth almost exactly in all three suburbs has a significant implication:
Renovations and improvements are not driving prices. If dwelling improvements were the primary driver of appreciation, we'd see land $/sqm growing slower than total prices. The data shows parity — meaning the market is paying for land, not for what's built on it.
This is consistent with the h13 growth decomposition analysis (see our earlier article on land vs dwelling growth drivers), which classified Robina and Burleigh Waters as "dwelling-driven" on a technical basis but showed very tight margins — and Varsity Lakes as genuinely "land-driven."
The practical implication: the dwelling matters for immediate appeal, but land is the long-term value store. A well-renovated house on a small lot will sell well today. It may not outperform a less-renovated house on a larger lot over a 10-year hold.
Benchmarking Your Property
For sellers: Use the tables above to benchmark your asking price. If your Robina property sits on a 750 sqm lot, the market currently prices land at approximately $1,880/sqm. With 750 sqm, that's $1.41 million in land value alone — before accounting for the dwelling. If comparables in your price bracket have 500 sqm lots, your larger land should support a premium of approximately $235,000 (the 250 sqm difference × $940 marginal rate at that range).
For buyers: When evaluating two similar properties, strip out the land value first. Is the price premium for the larger lot consistent with the $/sqm rates above? If it's significantly higher, you may be paying a scarcity premium that the market data doesn't fully support — unless it's Burleigh Waters, where large-lot premiums are genuinely earned.
The Diminishing Returns Reality
The most counterintuitive finding in this analysis is the diminishing rate of land $/sqm as lots grow. A <400 sqm lot in Robina prices at $2,995/sqm while a 1,000 sqm lot prices at $1,566/sqm.
This doesn't mean big lots are bad value — the absolute price is still higher. But it means buyers discount marginal land. They'll pay well for the first 500 sqm (maximum usability) and increasingly less for each additional square metre beyond that. Land beyond what a typical family can practically use is priced at a structural discount.
The exception: Burleigh Waters' 800 sqm+ bracket, where scarcity overrides the diminishing returns effect.
Analysis based on house sales in Robina, Varsity Lakes, and Burleigh Waters, 2015–2025. Land $/sqm calculated as total sale price ÷ lot size. Marginal value derived from linear regression across 400–1,000 sqm lot range. Figures represent medians; individual property outcomes vary by street, aspect, dwelling quality, and timing.
By Will Simpson, Fields Real Estate
Keep reading:Gold Coast market data — prices, supply and selling times, updated as new sales settle.
Disclaimer: The information in this article is for general informational purposes only and does not constitute financial, investment, or valuation advice. Fields Real Estate (Licence No. 4832972) makes no warranty as to the accuracy or currency of data published. Readers should conduct their own due diligence and seek independent professional advice before making any property or investment decision. Read our full disclaimer →
Licensed Queensland real estate agent, founder of Fields Real Estate and Lead Analyst at Fields Research. Covering Gold Coast market data, comparable sales analysis and suburb intelligence.
Where does your own home sit?
Fields keeps a record of every active listing and recent sale across the southern Gold Coast, and reads any address against the sales around it — the comparables, the range they support, and the method behind it. This analysis of the Gold Coast comes from the same database.