What do comparable sales say about your home?Your home vs recent sales
Enter your address to see the comparable sales around it. Free, no sign-up.Free comparable sales for your address.
🔍
Analyst11 March 2026·Updated 15 September 2026·11 min read
Stop Watching Interest Rates: The Indicators That Actually Predict Gold Coast House Prices
Interest rates are a lagging indicator. By the time they move, the market has already reacted. Here are the signals that actually precede Gold Coast price movements — and how to read them.
Last Edit: 11/02/2026, 9:34 AM (Tuesday) — Brisbane Time
Everyone watches the RBA's interest rate decisions, waiting for the signal to buy or sell. But by the time rates move, the market has already shifted. Our analysis of 10 years of Gold Coast data reveals which indicators actually lead price movements—and why you're looking at the wrong numbers.
The Problem: You're Watching Lagging Indicators
Picture this: It's February 2024. The RBA announces an interest rate cut. Property headlines explode. Buyers rush to the market, thinking they've spotted the perfect entry point.
But here's what they don't realise: Gold Coast house prices started rising 12 months earlier—in February 2023. The rate cut didn't cause the price rise. It confirmed what had already happened.
This is the fundamental mistake most property buyers and sellers make: they're watching lagging indicators and thinking they're predictive.
Leading vs Lagging: What's the Difference?
Let's clarify the terminology, because this distinction is crucial:
Leading Indicators
These move BEFORE house prices change. They give you advance warning—typically 3-6 months—of where the market is heading. Think of them as the canary in the coal mine.
Example: Wage growth accelerates in Q1 2024, then house prices rise in Q2-Q3 2024
Lagging Indicators
These move AFTER house prices have already changed. They confirm what's happened, but offer no predictive value. By the time they move, you've missed the opportunity.
Example: House prices rise in Q1 2024, then RBA raises rates in Q1 2025
Concurrent Indicators
These move AT THE SAME TIME as house prices. They tell you what's happening right now, but don't predict the future.
Example: Consumer spending and house prices both rise in Q2 2024
The Data: 10 Years of Gold Coast Price Movements
We analysed quarterly median house prices across 8 Gold Coast suburbs from 2015 to 2025, comparing them against key economic indicators. The results are striking.
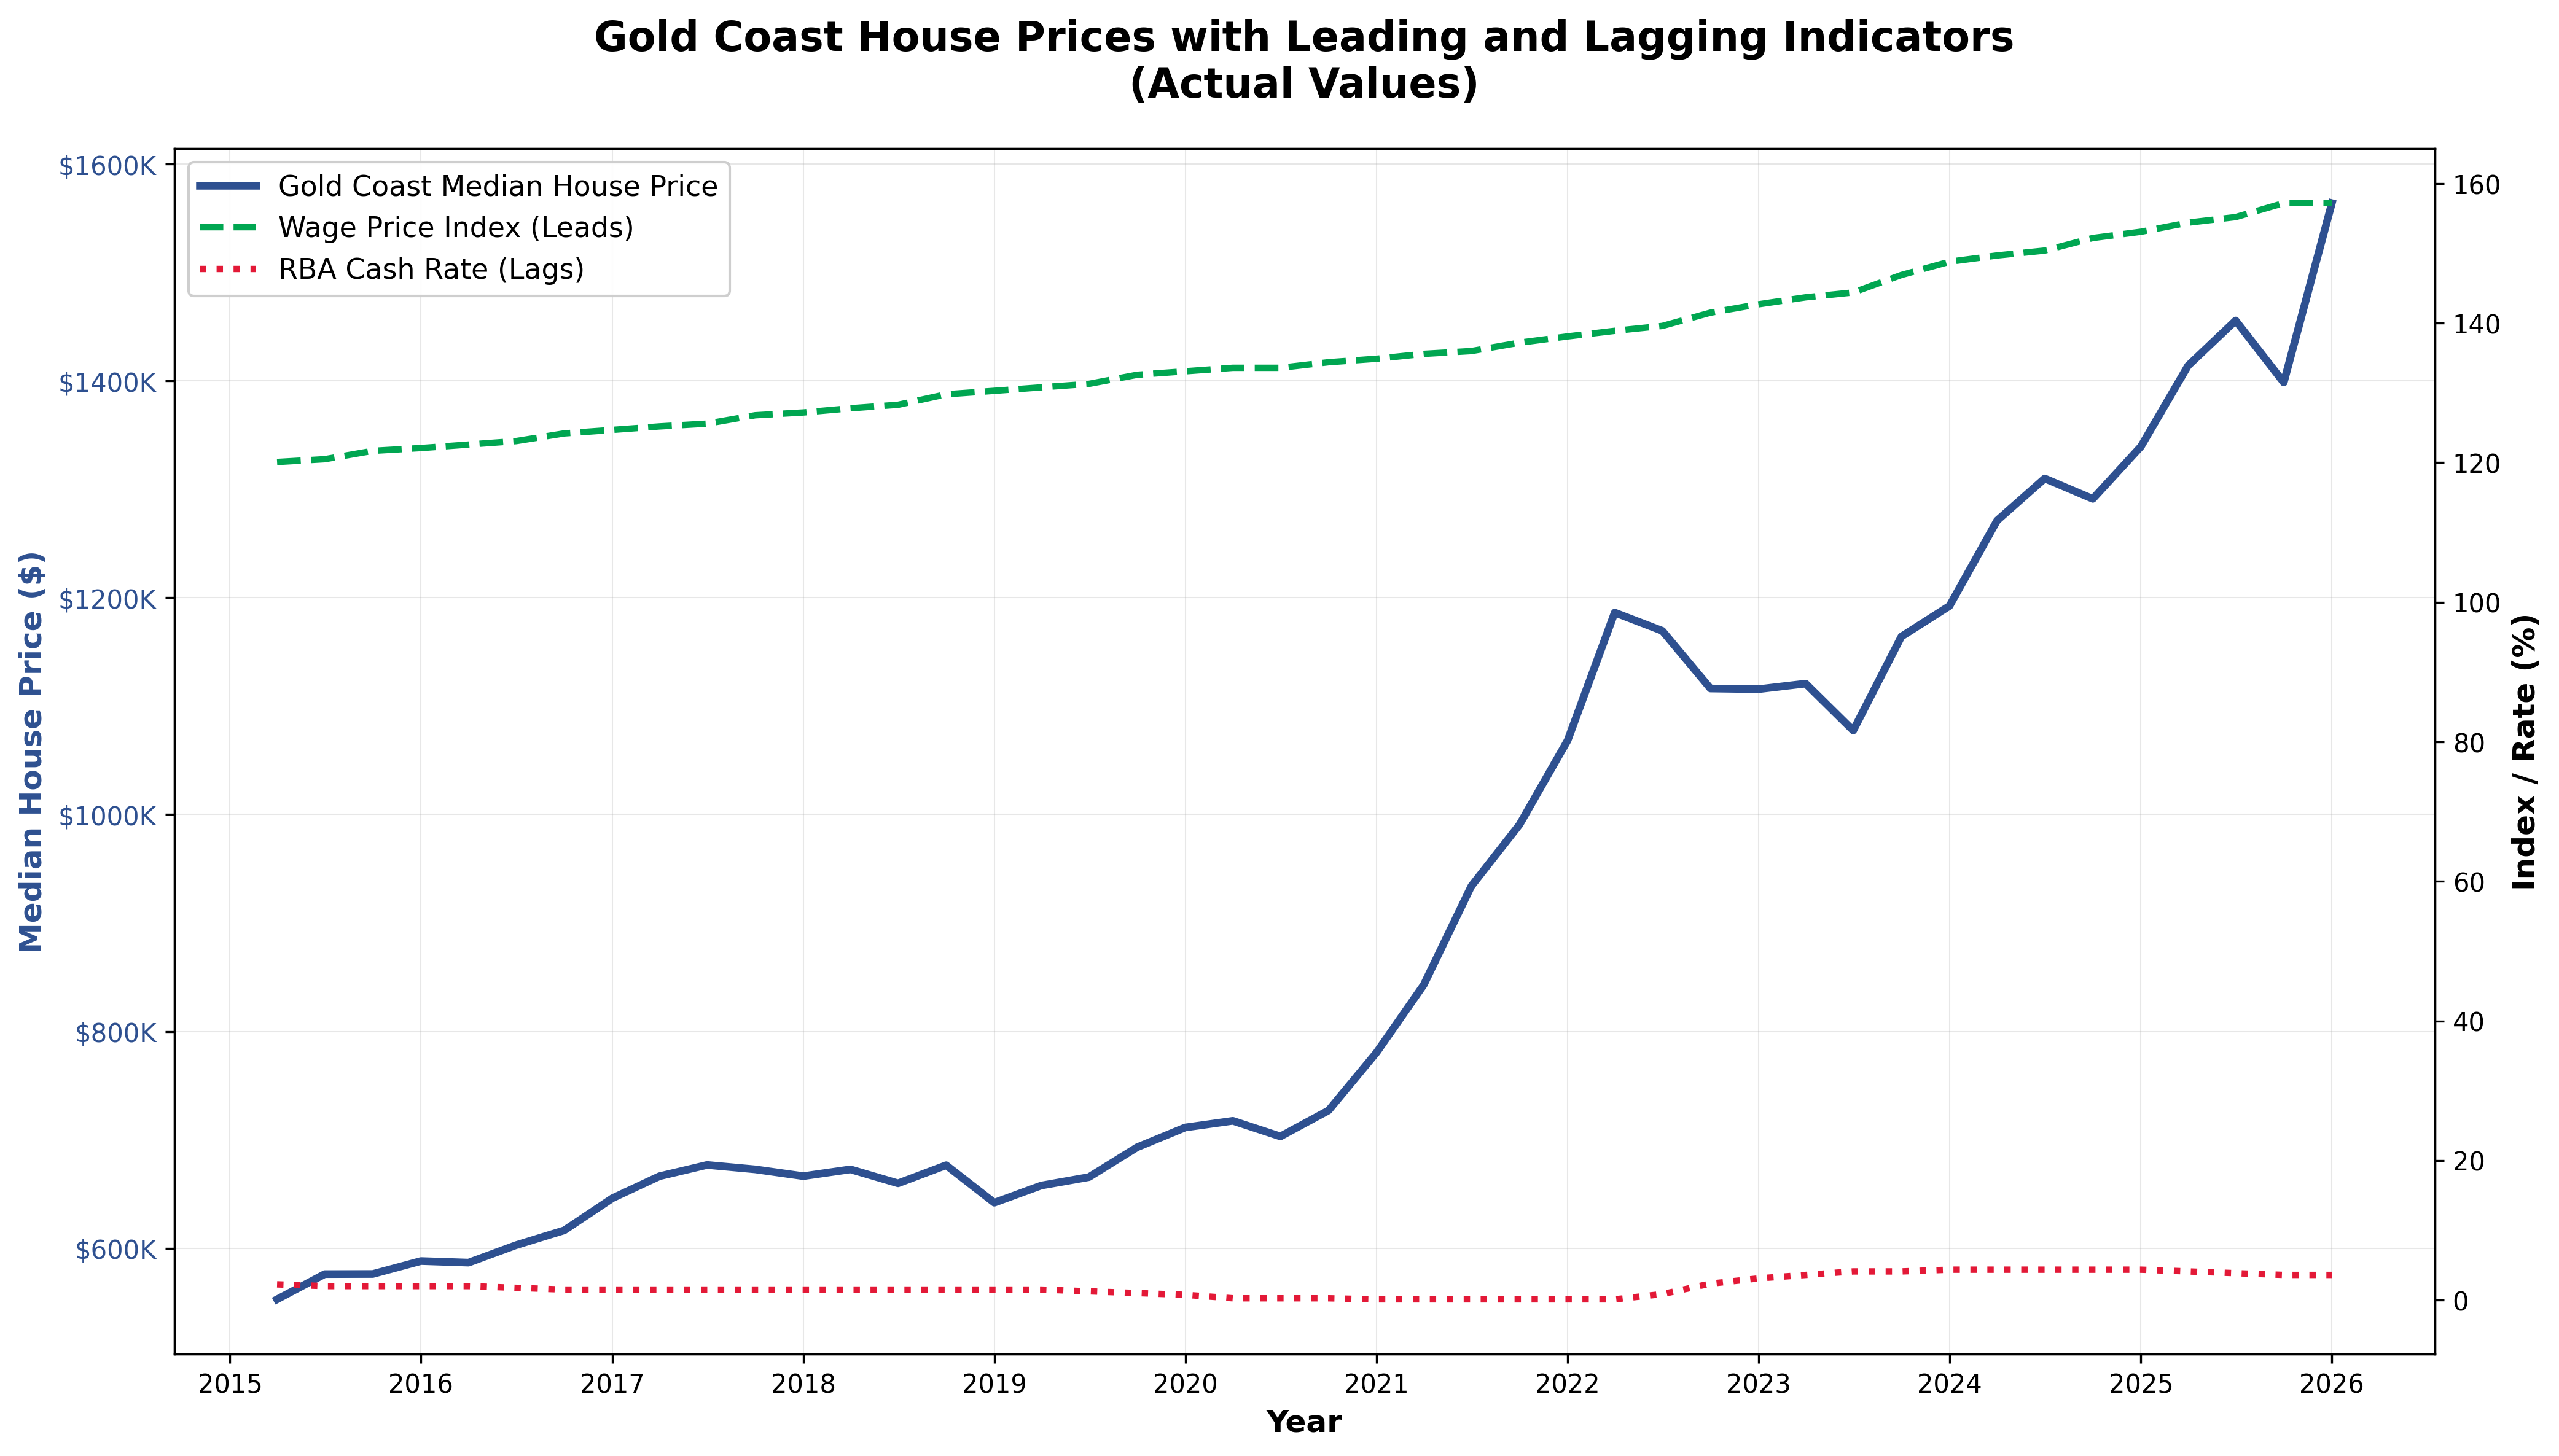
Figure 1: Gold Coast median house prices overlaid with Wage Price Index (leading) and RBA Cash Rate (lagging). Notice how wages move first, prices follow, and interest rates trail behind.
The chart tells a clear story:
Wage Price Index (green dashed line) moves first
House Prices (blue solid line) follow 3-4 months later
RBA Cash Rate (red dotted line) adjusts 12 months after prices have moved
This isn't a one-off pattern. It repeats consistently across the entire decade.
The Complete Picture: All Indicators Ranked by Timing
Based on our analysis of 27 economic indicators, here's the complete ranking from strongest leading indicators to longest lagging indicators:
Rank
Economic Indicator
Lead/Lag Timing
In Plain English
Observed lead or lag
1
Retail Turnover QLD
Leads by 5.4 months
Moved 5-6 months before prices
Excellent
2
Wage Price Index QLD
Leads by 4.2 months
Moved 4 months before prices
Excellent
3
Job Vacancies
Real-time (0 months)
Shows current market strength
Moderate
4
Household Spending QLD
Real-time (0 months)
Shows current market strength
Moderate
5
Household Spending AUS
Real-time (0 months)
Shows current market strength
Moderate
6
Company Profits
Real-time (0 months)
Shows current market strength
Moderate
7
Total Bank Lending
Lags by 4.2 months
Confirms what happened 4 months ago
Limited
8
RBA Cash Rate
Lags by 12 months
Confirms what happened a year ago
None
What This Table Tells You:
Leading Indicators (Ranks 1-2): These moved BEFORE prices changed. Over the period measured, acceleration in these series was followed by price growth 4-6 months later.
Concurrent Indicators (Ranks 3-6): These move AT THE SAME TIME as prices. They tell you what's happening right now, but don't predict the future. Useful for confirming current market strength.
Lagging Indicators (Ranks 7-8): These move AFTER prices have already changed. By the time you see movement here, the opportunity has passed. They confirm what already happened but offer no predictive value.
The Critical Insight: The two indicators most people watch (bank lending and interest rates) are both lagging indicators. They're looking in the rearview mirror whilst thinking they're looking ahead.
Why Interest Rates Lag (And Why Everyone Watches Them Anyway)
The RBA doesn't set interest rates to predict the property market—they set them to respond to economic conditions, including property price movements.
Here's the RBA's actual process:
Economic data comes in (employment, inflation, asset prices)
RBA board meets monthly to review
If conditions warrant, they adjust rates
The market reacts
By the time step 4 happens, property prices have typically been moving for 9-12 months.
So why does everyone watch interest rates?
Because they're:
- Highly publicised (front page news every month)
- Easy to understand (rates up equals borrowing costs up)
- Directly relevant to mortgage holders
But visibility doesn't equal predictive power.
The Real Leading Indicator: Wage Growth
Our analysis found that Queensland's Wage Price Index leads Gold Coast house prices by approximately 1.4 quarters (3-4 months).
This makes intuitive sense:
Wages rise, so workers have more disposable income
Confidence increases as people feel secure in their jobs
Borrowing capacity improves because banks lend more based on higher incomes
Demand for property rises as buyers enter the market
Prices increase 3-4 months after wage growth began
How to Track Wage Growth
The Australian Bureau of Statistics (ABS) publishes the Wage Price Index quarterly. Here's what to watch:
Pattern that preceded price growth:
- Wage growth accelerating for 2 or more consecutive quarters
- Queensland outpacing national average
- Private sector wages growing faster than public sector
Neutral Signal (Stable Market):
- Wage growth steady at long-term average (approximately 2-3% annually)
- Queensland tracking national average
Warning Signal (Prices May Soften):
- Wage growth decelerating for 2 or more quarters
- Queensland lagging national average
- Wage growth below inflation (real wages falling)
The Secondary Leading Indicator: Retail Turnover
Whilst not as strong as wage growth, Queensland retail turnover also shows a leading relationship with house prices (leading by approximately 1.8 quarters, or 4-5 months).
Retail spending is a proxy for consumer confidence. When people are confident about their financial future, they:
- Spend more on discretionary items
- Make major purchase decisions (including property)
- Take on debt more willingly
How to use this indicator:
Track the ABS Retail Trade data for Queensland. Look for:
- Rising trend: Consumers confident, so property demand likely to follow
- Falling trend: Consumers cautious, so property demand may soften
What About Other Indicators?
Our comprehensive analysis tested 27 economic indicators. Here's how they ranked:
Indicator
Relationship
Timing
Usefulness
Wage Price Index QLD
Leading
Plus 3-4 months
Longest observed lead
Retail Turnover QLD
Leading
Plus 4-5 months
Shorter observed lead
Household Spending QLD
Concurrent
Real-time
Confirms current strength
Job Vacancies
Concurrent
Real-time
Confirms current strength
Total Bank Lending
Lagging
Minus 3.5 months
Confirms past movements
RBA Cash Rate
Lagging
Minus 12 months
No predictive value
Where These Indicators Are Published
Every series referenced above is published free by the Australian Bureau of Statistics. For readers who want to follow the same data we do:
Wage Price Index, Queensland
Released quarterly by the ABS. In the period we measured, the pattern was:
- Two or more consecutive quarters of acceleration preceded house-price growth by 3-4 months
- Queensland outpacing the national average coincided with stronger local movement
- Deceleration over two or more quarters preceded softening by a similar interval
These are relationships observed in past data. A lead that held over the period measured may or may not hold in future, and a single quarter is not a trend.
Retail Turnover, Queensland
Released monthly by the ABS. Retail spending acted as a proxy for consumer confidence, leading house prices by approximately 4-5 months in our dataset — a weaker relationship than wages, and one we would not read on its own.
Interest Rates
The cash rate moved after Gold Coast prices, not before them, by approximately 12 months across the period analysed. That is a statement about the order in which the two series moved historically. It is not a claim about what either will do next, and it does not mean rate changes have no effect on borrowing capacity — only that, in this dataset, they did not precede price movements.
What the ranking does and does not tell you
This analysis measures the order in which series moved, not causation, and not magnitude. Correlation over one cycle in one region is thin evidence for any individual decision. Personal circumstances — finance, timing, the specific property — sit outside anything a macro indicator can speak to, and this article does not attempt to weigh them.
Real-World Example: The 2023-2024 Cycle
Let's look at how this played out recently:
Q1 2023: Queensland wage growth accelerates to 4.1% annually (up from 3.2%)
Q2-Q3 2023: Gold Coast median house prices begin rising (up 6.8% over 6 months)
Q1 2024: RBA finally cuts rates (12 months after prices started rising)
Over this particular cycle, the wage series moved 3-4 months before prices and the cash rate moved about 12 months after them. Prices rose 6.8% in the interval between the two. That is one cycle in one region, and it is the same cycle the lead time was measured on — it illustrates the relationship rather than independently confirming it.
Why This Matters More Than Ever
In today's market, information asymmetry creates opportunity. Most buyers and sellers are:
Reading property headlines (which focus on interest rates)
Listening to bank economists (who discuss rate forecasts)
True, but borrowing capacity is only one factor. Wage growth affects:
- Borrowing capacity (higher income equals bigger loans)
- Deposit savings (higher wages equals faster savings)
- Confidence (wage security equals willingness to buy)
- Actual repayment ability (not just theoretical capacity)
Wage growth is the upstream cause. Interest rates are the downstream effect.
"The RBA uses forward-looking data, so rates must be predictive!"
The RBA uses forward-looking inflation data. Property prices are just one input into their decision-making, and they explicitly state they don't target asset prices. They're managing the economy, not predicting your suburb's median price.
"What if wages rise but rates rise even more?"
This is the wrong question. The question is: "What predicts price movements?" The answer is wages, not rates. Yes, rate rises can dampen demand, but they're a lagging response to economic strength—which wage growth has already signalled.
The Bottom Line
The Gold Coast property market is driven by economic fundamentals, not RBA announcements. Our analysis of 10 years of data proves:
Wage Price Index leads house prices by 3-4 months (r equals 0.940)
Retail turnover leads house prices by 4-5 months (r equals 0.672)
Interest rates lag house prices by 12 months (r equals 0.791)
If you want to predict where the market is heading, stop watching interest rate speculation and start tracking wage growth.
The next time someone tells you to "wait for rate cuts," ask them: "What's Queensland's wage growth doing?" If they don't know, they're not watching the right indicators.
How to Access the Data
All the indicators mentioned in this article are freely available:
Wage Price Index:
- Source: Australian Bureau of Statistics (ABS)
- Release: Quarterly (mid-February, May, August, November)
- Website: abs.gov.au, then Labour, then Wage Price Index
- Look for: Table 2a, Queensland, Total hourly rates excluding bonuses
Retail Turnover:
- Source: Australian Bureau of Statistics (ABS)
- Release: Monthly (approximately 4 weeks after month-end)
- Website: abs.gov.au, then Industry, then Retail Trade
- Look for: Table 11, Queensland, Total retail turnover
RBA Cash Rate:
- Source: Reserve Bank of Australia (RBA)
- Release: Monthly (first Tuesday of each month)
- Website: rba.gov.au, then Statistics, then Interest Rates, then Cash Rate
Set a calendar reminder for each release date. Spend 10 minutes per quarter reviewing the trends. That's all it takes to stay ahead of the market.
Methodology Note
This analysis examined quarterly median house prices for 8 Gold Coast suburbs (Robina, Mudgeeraba, Varsity Lakes, Reedy Creek, Burleigh Waters, Merrimac, Worongary, and Carrara) from Q1 2015 to Q4 2025.
Economic indicators were sourced from the Australian Bureau of Statistics (ABS) and Reserve Bank of Australia (RBA). Time-lag analysis tested correlations at plus or minus 8 quarter offsets to identify leading and lagging relationships.
All data sources are publicly available. The analysis is reproducible using the methodology described in our companion article, "What Really Drives Gold Coast House Prices?"
Data analysis conducted February 2026. Property price data sourced from internal database. Economic indicators from Australian Bureau of Statistics and Reserve Bank of Australia.
Keep reading:Gold Coast market data — prices, supply and selling times, updated as new sales settle.
Disclaimer: The information in this article is for general informational purposes only and does not constitute financial, investment, or valuation advice. Fields Real Estate (Licence No. 4832972) makes no warranty as to the accuracy or currency of data published. Readers should conduct their own due diligence and seek independent professional advice before making any property or investment decision. Read our full disclaimer →
Licensed Queensland real estate agent, founder of Fields Real Estate and Lead Analyst at Fields Research. Covering Gold Coast market data, comparable sales analysis and suburb intelligence.
Where does your own home sit?
Fields keeps a record of every active listing and recent sale across the southern Gold Coast, and reads any address against the sales around it — the comparables, the range they support, and the method behind it. This analysis of the Gold Coast comes from the same database.


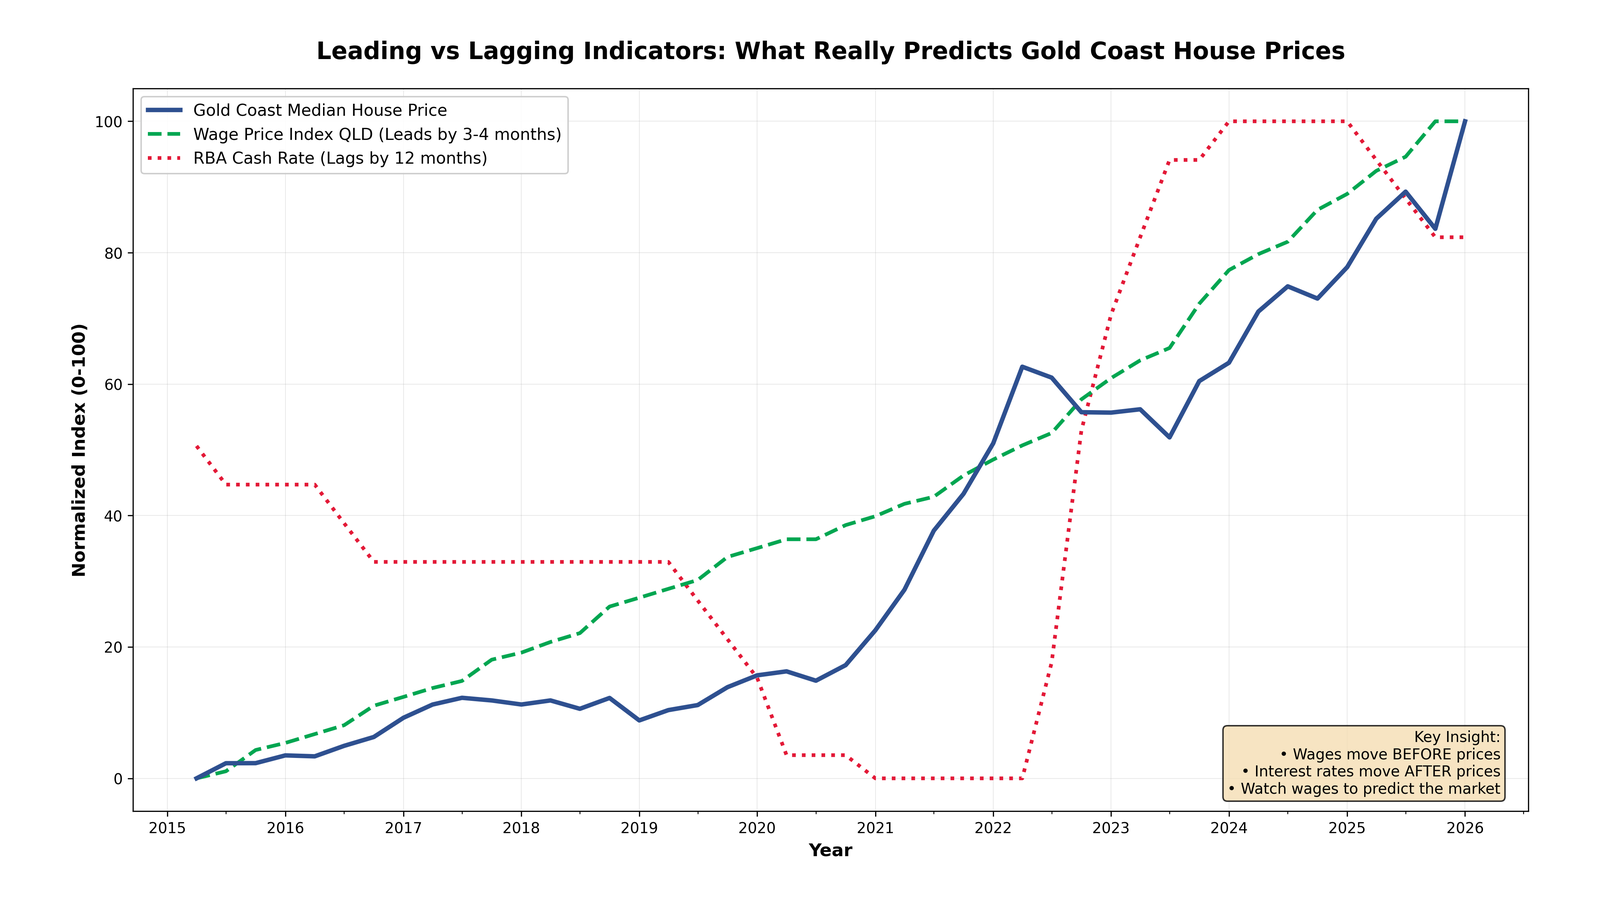

 Figure 1: Gold Coast median house prices overlaid with Wage Price Index (leading) and RBA Cash Rate (lagging). Notice how wages move first, prices follow, and interest rates trail behind.