What do comparable sales say about your home?Your home vs recent sales
Enter your address to see the comparable sales around it. Free, no sign-up.Free comparable sales for your address.
🔍
Analyst11 March 2026·Updated 15 September 2026·4 min read
Is Now a Good Time to Buy in Varsity Lakes?
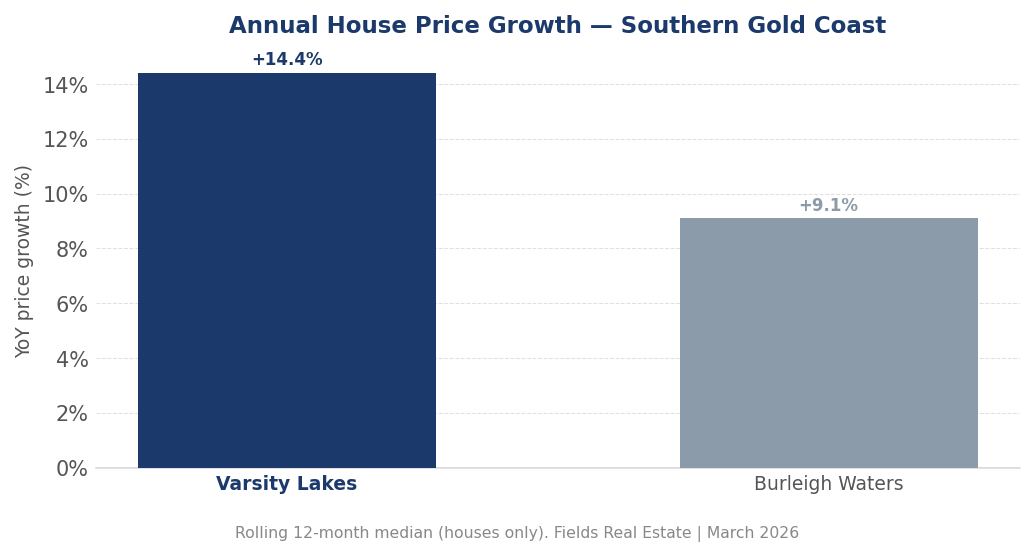
Varsity Lakes house prices have risen +14.4% over the past rolling 12 months. The rolling 12-month median house price sits at $1,350,000. In that same period, the number of houses that sold rose by +13.7%.
Varsity Lakes house prices have risen +14.4% over the past rolling 12 months. The rolling 12-month median house price sits at $1,350,000. In that same period, the number of houses that sold rose by +13.7%. Prices are climbing and so is activity — but the days-on-market figure tells a more complicated story.
Where Are We in the Cycle?
The two-year run in Varsity Lakes is worth mapping clearly. Two years ago, the rolling 12-month median house price was $1,021,500. Twelve months later, it had moved to $1,180,000. Today it sits at $1,350,000. That is a gain of $328,500 across two years — roughly +32.2%. The market is in expansion phase, and vendors are pricing with confidence.
Annual house price growth — southern Gold Coast suburbs
Look at how that growth has distributed across the two periods. The dollar gain from two years ago to one year ago was $158,500. From one year ago to today, $170,000. Unlike some suburbs where the growth rate is visibly softening, Varsity Lakes has actually accelerated slightly in the second period. That is worth noting — and worth being honest about as a buyer. You are not entering a market that is showing early signs of fatigue at the price level.
The interquartile range adds useful context. The lower quartile sits at $1,200,000 and the upper quartile at $1,490,000 — a spread of $290,000. For a house market at this price point, that is a reasonably contained band. Varsity Lakes is a structurally consistent suburb. Buying at $1,350,000 today means paying a price that would have looked ambitious two years ago. That run compresses the margin for error, and it means there is limited scope to find undervalued pockets by hunting within the suburb itself.
Buyer Power Right Now
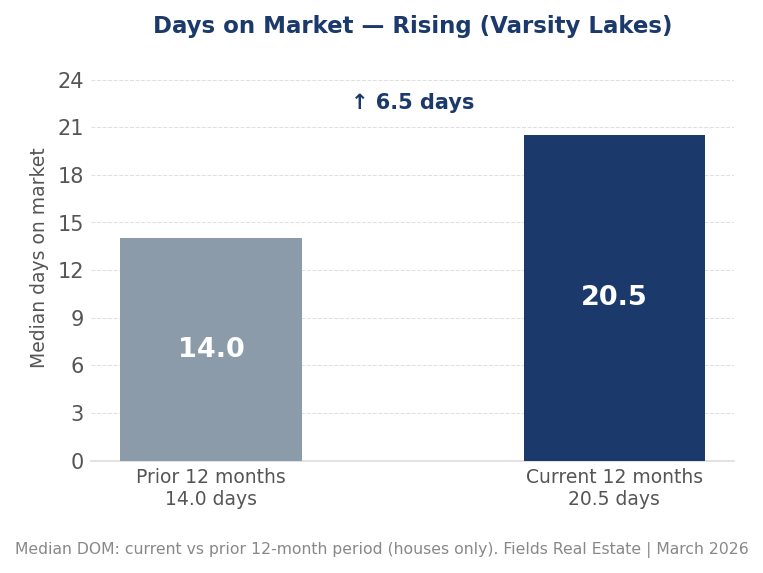
Twelve months ago, the median Varsity Lakes house sold in 14.0 days. That figure has risen to 20.5 days. The direction is clear — vendors are waiting longer to find a buyer.
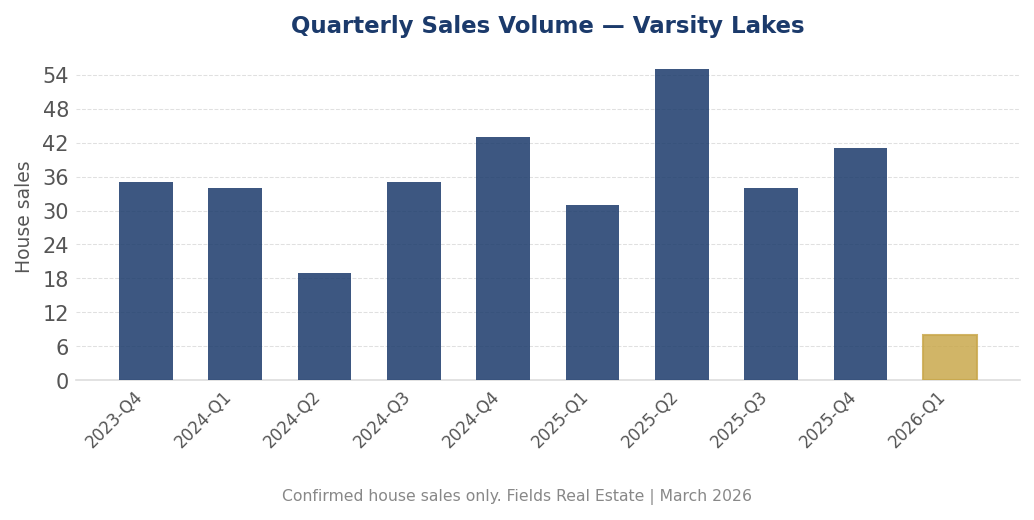
Quarterly house sales — Varsity Lakes
The volume picture is different from what you might expect given that DOM reading. There were 131 house sales in the prior 12-month period. In the last 12 months, 149 — an increase of +13.7% across a healthy transaction count. More houses are selling, not fewer. This is not a market where buyers have retreated.
Median days on market — Varsity Lakes
Put those two signals together and you get a nuanced read. Rising days on market alongside rising sales volume suggests the market has more stock coming through — not that buyers are losing conviction. The buyer power reading sits at balanced, which is accurate. Vendors are not under pressure, but neither are buyers scrambling to compete in the way they might have 18 months ago. A prepared buyer with clean finance and a straightforward contract still carries leverage on a property that has been sitting for three weeks or more. That was not true at the sharper end of this cycle.
This is not a buyer's market. But the frantic, multiple-offer conditions of prior years have eased. There is room to move deliberately and negotiate without urgency — and that shift has practical value.
Where the Cash Rate Sits
The RBA cash rate is 4.35% as at 6 August 2026. Over 2026 it has risen, not fallen: it stood at 3.60% through the December 2025 quarter, 4.10% at the end of the March 2026 quarter, and 4.35% from the June 2026 quarter. Higher rates reduce the amount a given buyer can borrow, which narrows the pool of purchasers able to qualify at any particular price. How large that effect has been in Varsity Lakes specifically is not something these figures measure.
The cash rate also tracks Gold Coast prices with a lag of roughly 12 months, so a rate decision describes conditions that already existed rather than conditions still to come. Source: RBA cash rate series, to 6 August 2026.
Queensland wage growth has historically led Gold Coast prices by roughly one quarter. That series was not available for the period covered here, so no forward wage signal is applied.
The Figures, Together
Rolling 12-month median house price: $1,350,000, after a two-year run that added more than $328,500 to the median.
Days on market: 20.5, and rising against the prior period.
Sales volume: 149 house sales over 12 months.
Queensland Wage Price Index, which has historically led Gold Coast prices by roughly one quarter: not available for this period.
RBA cash rate: 4.35% as at 6 August 2026, up from 3.60% in the December 2025 quarter.
Two years of accelerating median growth and a lengthening time on market sit in the same record. The forward indicator that would ordinarily help read them together is missing for this period.
Keep reading:Varsity Lakes market data — prices, supply and selling times, updated as new sales settle.
Analysis based on 149 confirmed house sales from the Gold Coast — Varsity Lakes database. All figures are for houses only. Sales, listing and days-on-market figures are as at 3 March 2026; the cash rate is as at 6 August 2026. Last reviewed: 2026-08-16. Fields Real Estate | Southern Gold Coast.
Licensed Queensland real estate agent, founder of Fields Real Estate and Lead Analyst at Fields Research. Covering Gold Coast market data, comparable sales analysis and suburb intelligence.
Where does your own home sit?
Fields keeps a record of every active listing and recent sale across the southern Gold Coast, and reads any address against the sales around it — the comparables, the range they support, and the method behind it. This analysis of the Gold Coast comes from the same database.