What do comparable sales say about your home?Your home vs recent sales
Enter your address to see the comparable sales around it. Free, no sign-up.Free comparable sales for your address.
🔍
Analyst7 April 2026·Updated 15 September 2026·5 min read
Is Now a Good Time to Buy in Robina?
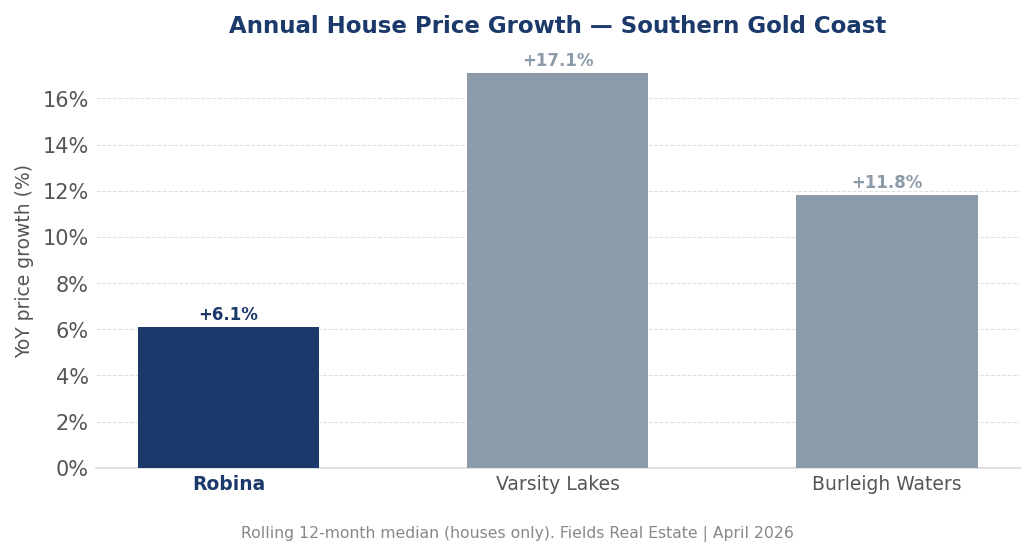
Robina's rolling 12-month median house price sits at $1,438,750 — up +6.1% on the prior year and nearly double what it was five years ago. That is the market you are buying into.
Robina's rolling 12-month median house price sits at $1,438,750 — up +6.1% on the prior year and nearly double what it was five years ago. That is the market you are buying into.
By Will Simpson | April 2026
The rolling 12-month median house price in Robina stands at $1,438,750. Twelve months ago it was $1,355,444. Two years ago, $1,150,000. Five years ago, $750,000. The suburb has added $688,750 in median house value over five years, compounding at +13.9% per year. The most recent twelve months contributed $83,306 — a slower pace than the five-year average, but still positive and deliberate. Robina has not stalled. It is settling into a more measured stride.
Where Are We in the Cycle?
The rolling 12-month median gain of +6.1% is real and consistent. More telling is where Robina sits relative to its own long-run trajectory: just +0.1% above its five-year trend line. That is not a market running hot on speculation. It is a market tracking almost exactly where the data would predict it to be.
Annual house price growth — southern Gold Coast suburbs
A buyer entering in April 2026 is not arriving at the earliest stages of a run — but the data does not suggest a market that has overshot either. The five-year compound annual growth rate of +13.9% reflects a suburb that moved hard and has found a tempo closer to sustainable. The current phase is classified as a seller's market. That framing matters when you sit down to negotiate, but the buyer power signals below add important nuance.
Buyer Power Right Now
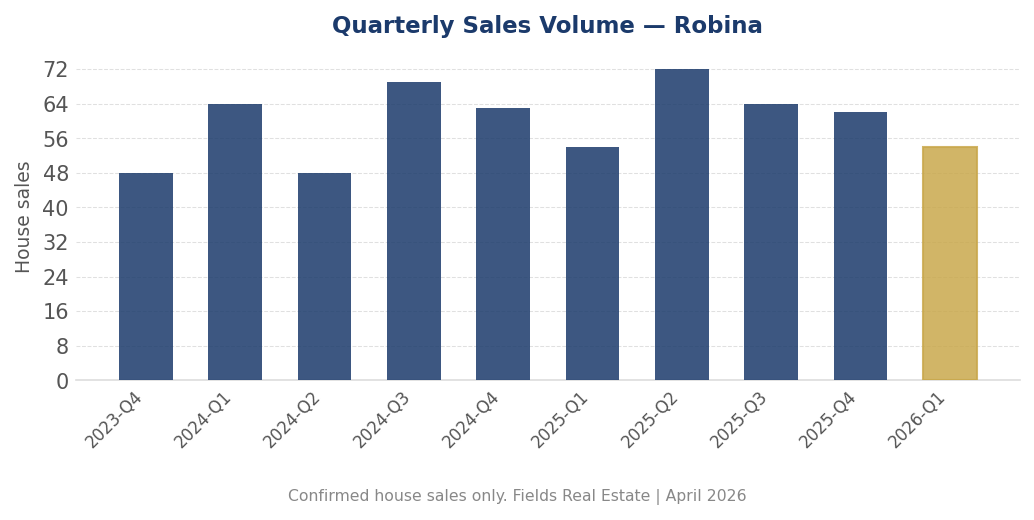
Robina recorded 252 house sales over the past twelve months. In the prior twelve months, 234 homes transacted — volume essentially flat year on year, across 252 confirmed sales. More buyers are not flooding in, but existing demand is holding firm at current prices.
Quarterly house sales — Robina
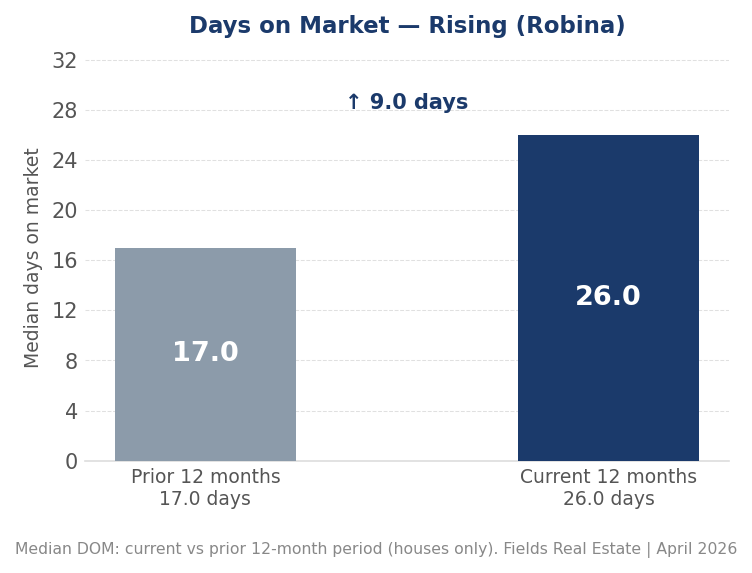
The rolling 12-month median days on market sits at 26 days, up from 17 days in the prior period. That directional shift matters. Stock is taking longer to clear than it was a year ago.
Median days on market — Robina
For buyers, a rising days-on-market figure creates something the prior two years rarely offered: time to think. Flat volume and rising days on market together produce a buyer power reading of buyer-favoured. That is a notable shift. It does not mean vendors are capitulating on price — the median is still rising. But it does mean a well-prepared buyer with a clear brief has more room to negotiate than they would have had twelve months ago, when homes were clearing in 17 days. A 26-day median means some stock is sitting. That is leverage, if you use it deliberately.
What the Rate Hikes Actually Mean
The RBA cut rates through 2025, bringing the cash rate down from 4.35% to 3.60%. It then reversed course: the rate rose to 3.85% in February 2026, stood at 4.10% at the end of the March 2026 quarter, and reached 4.35% in the June 2026 quarter. It is 4.35% as at 6 August 2026 — back to where it was in late 2024. Borrowing costs rose across that period. Source: RBA cash rate series, to 6 August 2026.
This will be framed by some as a reason to pause. The mechanics are worth examining more carefully before drawing that conclusion.
The correlation between RBA decisions and Gold Coast house prices is real — but rate decisions lag Gold Coast prices by approximately twelve months. The RBA reacts to what has already happened in the economy. By the time a hike is announced, the price conditions that prompted it are already in the rearview mirror. Using a rate hike as a forward price signal means responding to yesterday's data, not tomorrow's movement.
A more reliable forward indicator is the Queensland Wage Price Index. The most recent reading sits at 160.7 for the December 2025 quarter, reflecting annual growth of +3.3% against the December 2024 index of 155.5. Queensland wages lead Gold Coast prices by roughly one quarter. At +3.3%, wage growth is positive and running at a meaningful pace. That reading is positive, and it covers the December 2025 quarter.
The two series point in opposite directions over this period. Higher rates compress what a buyer can borrow; higher wages expand what they can service over time. Neither dominates the other in the data.
The Figures, Together
Rolling 12-month median house price: $1,438,750, at a five-year compound annual growth rate of +13.9%.
Position against the five-year trend: +0.1%.
Days on market: 26, against 17 a year earlier.
Sales volume: flat over the period.
Queensland Wage Price Index: 160.7 for the December 2025 quarter, +3.3% on the December 2024 reading of 155.5.
RBA cash rate: 4.35% as at 6 August 2026, up from 3.60% in the December 2025 quarter and level with late 2024.
A median sitting within 0.1% of its own five-year trend, days on market half as long again as a year earlier, and a cash rate back at its 2024 level are all in the record for this period. They are not all pointing the same way.
Analysis based on 252 confirmed house sales from the Gold Coast — Robina database. All figures are for houses only. Sales, listing and days-on-market figures are as at 7 April 2026; the cash rate is as at 6 August 2026. Last reviewed: 2026-08-16. Fields Real Estate | Southern Gold Coast.
Keep reading:Robina market data — prices, supply and selling times, updated as new sales settle.
Disclaimer: The information in this article is for general informational purposes only and does not constitute financial, investment, or valuation advice. Fields Real Estate (Licence No. 4832972) makes no warranty as to the accuracy or currency of data published. Readers should conduct their own due diligence and seek independent professional advice before making any property or investment decision. Read our full disclaimer →
Licensed Queensland real estate agent, founder of Fields Real Estate and Lead Analyst at Fields Research. Covering Gold Coast market data, comparable sales analysis and suburb intelligence.
Where does your own home sit?
Fields keeps a record of every active listing and recent sale across the southern Gold Coast, and reads any address against the sales around it — the comparables, the range they support, and the method behind it. This analysis of the Gold Coast comes from the same database.