What do comparable sales say about your home?Your home vs recent sales
Enter your address to see the comparable sales around it. Free, no sign-up.Free comparable sales for your address.
🔍
Analyst11 March 2026·Updated 15 September 2026·17 min read
The Three-Week Sweet Spot: Why Properties Selling in 15-21 Days Achieve the Highest Prices
Properties that sell in 15–21 days consistently achieve higher prices than those that sell faster or slower. Here's why the three-week window is the sweet spot — and what it means for your sale.
Last Edit: 12/02/2026, 2:30 PM (Wednesday) — Brisbane Time
Our analysis of 44,937 Gold Coast property sales reveals a striking pattern: properties that sell in the third week of their campaign achieve prices 4% higher than comparable properties. This isn't luck, it's the perfect balance of market exposure and buyer competition. Here's what the data shows about optimal selling timeframes.
The Question: What's the Optimal Time to Sell?
Every seller faces the same dilemma: accept an early offer or wait for better ones? Move too fast and you might leave money on the table. Wait too long and buyers assume something's wrong.
Our analysis of six years of Gold Coast sales data (2020-2025) reveals some interesting insights: properties selling in 15-21 days achieve the highest prices with an average of 4% more than comparable properties selling at other speeds.
What We Analysed: The Complete Dataset
To understand the relationship between days on market (DOM) and sale prices, we examined every house sale across 81 Gold Coast suburbs from 2020 to 2025:
Sample Size:
- 44,937 individual property sales
- 8 target market suburbs (Robina, Mudgeeraba, Varsity Lakes, Carrara, Reedy Creek, Burleigh Waters, Merrimac, Worongary)
- 6 years of data (2020-2025)
- All property types (houses, units, townhouses)
What We Measured:
- Days on market (DOM): The number of days from first listing to sale
- Sale price: The actual transaction price
- Property characteristics: Bedrooms, bathrooms, land size, property type
Our Methodology: Matched Cohort Analysis
To isolate the effect of days on market on sale prices, we used a statistical technique called matched cohort analysis (also known as stratified comparison). Here's what that means in plain English:
The Problem We're Solving
If we simply compared fast-selling properties to slow-selling properties, we'd be comparing apples to oranges. Fast-selling properties might be cheaper, smaller, or in better locations. We need to compare like-with-like.
How Matched Cohort Analysis Works
Think of it like this: imagine you have two identical houses on the same street, same bedrooms, same bathrooms, same land size. One sells in 7 days, the other takes 75 days. The price difference between these two properties tells us the true cost of waiting.
Our Process:
Create Strata (Groups): We grouped properties with identical characteristics:
Same suburb
Same number of bedrooms
Same number of bathrooms (strict matching only)
Similar land size (strict matching only)
Same property type
Compare Within Groups: Within each group (called a "stratum"), we compared properties that sold at different speeds
Calculate Price Differences: For each stratum, we calculated: "How much more (or less) did fast-selling properties achieve compared to slow-selling properties?"
Aggregate Results: We combined results across all strata to find the overall pattern
Two Matching Approaches:
We used two levels of matching to ensure our findings were robust:
Core Matching: Matched on suburb, bedrooms, and property type (99-103 strata)
Strict Matching: Also matched on bathrooms and land size (85-103 strata)
Both methods showed the same pattern, confirming our findings are real, not statistical noise.
The Baseline: 22-60 Days
We chose properties selling in 22-60 days as our baseline (reference point) because:
- This represents "normal" market behaviour (29.3% of all sales)
- It's neither rushed nor stale
- It provides a stable comparison point
All other DOM buckets are compared against this baseline.
The Complete Picture: What We Found
Here's what happens to sale prices at different speeds:
Days on Market
Price vs Baseline
Sample Size
What This Means
0-7 days
−2.5%
8,671 sales
Too fast—limited buyer competition
8-14 days
−2.6%
7,241 sales
Still too fast—insufficient exposure
15-21 days
+4.0%
4,628 sales
OPTIMAL — Perfect timing achieves premium
22-60 days
0.0% (baseline)
13,183 sales
Normal market behaviour
61-90 days
−7.4%
4,312 sales
DANGER ZONE — Market stigma begins
91-120 days
−8.4%
2,277 sales
SEVERE PENALTY — Worst performance
121-180 days
+2.8%
2,166 sales
Selection bias (unique properties)
180+ days
−2.9%
2,459 sales
Mixed (distressed + unique)
Figure 1: Price premium or discount relative to properties selling in 22-60 days. Notice the 15-21 day sweet spot achieves the highest prices, whilst the dramatic cliff after 60 days shows severe penalties.
The Critical Finding: The 15-21 Day Sweet Spot
The most important discovery in our analysis is what we call the 15-21 day sweet spot—the optimal window where properties achieve the highest prices.
Why 15-21 Days Works:
This timing creates the perfect conditions for maximum sale price:
Sufficient Online Exposure (Week 1-2):
Property appears in search results and email alerts
Buyers discover the listing and add it to their watchlists
Word spreads through buyer networks and agents
Serious buyers schedule inspections
Multiple Inspection Opportunities (Week 2-3):
First open home (weekend 1): Initial interest gauged
Second open home (weekend 2): Serious buyers return
Private inspections (weekdays): Motivated buyers get closer look
Buyers have time to do due diligence without feeling rushed
Competition Develops (Week 3):
Multiple interested parties identified
Buyers know others are interested (creates urgency)
Offers come in before market fatigue sets in
Seller can negotiate from position of strength
The Data Confirms This:
- Properties selling in 15-21 days achieve 4% premium over baseline
- This represents $40,000 extra on a $1,000,000 property
- Sample size: 4,628 sales (statistically robust)
Why Faster Isn't Better
Properties selling in 0-14 days achieve 2.5% less than the sweet spot:
0-7 Days (−2.5%):
- Only one weekend of inspections
- Limited buyer pool has seen the property
- No time for competition to develop
- Buyers haven't done full due diligence
- Seller accepts first strong offer without testing market depth
8-14 Days (−2.6%):
- Two weekends, but still limited exposure
- Buyers feel rushed to make decisions
- Competition hasn't fully developed
- Market depth not properly tested
The Logic: Whilst these sales are successful, they haven't allowed enough time for the full buyer pool to discover the property and compete.
Why Slower Becomes Dangerous
After 60 days, the market perception shifts dramatically:
61-90 Days (−7.4% penalty):
- Market assumes property is overpriced or has issues
- Agents stop actively promoting
- Buyer stigma: "If it was good, it would have sold"
- Seller desperation becomes apparent
91-120 Days (−8.4% penalty):
- Severe market stigma
- Only bargain hunters remain interested
- Property becomes "stale listing"
- Comparable properties sell for $84,000 less (on $1,000,000 property)
The Tipping Point: In our target market suburbs, the median days on market is 27 days. Properties still on market after 60 days are in the bottom 15%—the market has decided something is wrong.
The Logic Behind the Sweet Spot: A Practical Example
Let's walk through why 15-21 days creates optimal conditions using a real scenario:
Scenario: $1,200,000 Property in Robina
Week 1 (Days 1-7): Discovery
- Property goes live on major portals
- 47 buyers view online, 12 enquire
- First open home: 22 groups attend
- Result: 6 serious buyers identified, but none ready to offer
Week 2 (Days 8-14): Evaluation
- 3 buyers arrange building inspections
- 2 buyers review contracts with solicitors
- Second open home: 18 groups (mix of new and returning)
- Result: Buyers doing due diligence, need more time
Week 3 (Days 15-21): Competition
- First offer: $1,150,000
- Second offer: $1,165,000
- Agent creates competitive tension
- Result: Sells for $1,248,000 (4% above comparable sales)
Contrast: Same Property Selling in 5 Days
First open home Saturday: 22 groups
Strong offer Sunday: $1,150,000
Seller accepts Monday (day 5)
Cost of rushing: $98,000 left on the table
What was missed: 25 other buyers who would have discovered it in week 2, buyers who needed time for inspections, and the opportunity to create competition.
Real-World Examples: What the Sweet Spot Achieves
Example 1: $1,000,000 Property
Scenario
Days on Market
Expected Price
Difference from Optimal
Too fast
5 days
$975,000
−$65,000
Still too fast
12 days
$974,000
−$66,000
OPTIMAL
18 days
$1,040,000
$0 (reference)
Normal
40 days
$1,000,000
−$40,000
Danger zone
75 days
$926,000
−$114,000
Severe penalty
105 days
$916,000
−$124,000
Example 2: $1,500,000 Property
Scenario
Days on Market
Expected Price
Difference from Optimal
Too fast
5 days
$1,462,500
−$97,500
Still too fast
12 days
$1,461,000
−$99,000
OPTIMAL
18 days
$1,560,000
$0 (reference)
Normal
40 days
$1,500,000
−$60,000
Danger zone
75 days
$1,390,000
−$170,000
Severe penalty
105 days
$1,374,000
−$186,000
The Key Insight: The 15-21 day window achieves the highest prices because it allows sufficient time for buyer discovery, multiple inspections, and competitive offers—whilst avoiding market fatigue. Selling too fast leaves $60,000-$100,000 on the table. Waiting past 60 days costs even more.
The Key Insight: The 15-21 day window achieves maximum value because it allows the complete buyer journey (discovery → evaluation → competition) whilst maintaining market freshness. Selling too fast means incomplete market testing. Waiting too long triggers market stigma.
The Three Zones: A Framework for Sellers
Based on our analysis, we can divide the market into three distinct zones:
Zone 1: The Optimal Window (15-21 Days) — Maximum Value
What This Means:
Price your property to sell in this window. The three-week timeline allows buyers to discover the property (week 1), complete due diligence (week 2), and compete for it (week 3)—achieving maximum value whilst maintaining market freshness.
Zone 2: Too Fast (0-14 Days) — Leaving Money on the Table
Characteristics:
- 0-7 days: −2.5% vs optimal (−$65,000 on $1,000,000)
- 8-14 days: −2.6% vs optimal (−$66,000 on $1,000,000)
- Risk: Moderate (missed opportunity)
- Market perception: Underpriced or distressed
What This Means:
Selling in the first two weeks means limited buyer discovery, no time for competition to develop, and accepting the first strong offer without testing market depth. You're likely leaving $60,000-$100,000 on the table.
Zone 3: Normal Sales (22-60 Days) — Baseline
Characteristics:
- Price: At market value (0% difference)
- Risk: Moderate (approaching the cliff)
- Market perception: Normal marketing period
What This Means:
Standard market behaviour, but as you approach day 60, urgency increases. If you're at day 45-50 with no strong offers, take action immediately.
What This Means:
Once you're past 60 days, you're in crisis mode. Every additional week on market costs you money. Immediate action is required—not minor tweaks, but significant intervention.
Why the 15-21 Day Window Achieves Premium Prices
The sweet spot reflects the natural buyer journey:
Days 1-7 (Discovery): Property goes live, buyers discover it in searches, first open home scheduled
Days 8-14 (Evaluation): First open home attracts 15-30 groups, building inspections arranged, contract reviews begin
Days 15-21 (Competition): Multiple parties express interest, competition becomes visible, offers submitted, seller negotiates from strength
Why This Creates Premium Prices:
1. Full market exposure—every serious buyer has discovered the property
2. Informed buyers—due diligence completed, confident offers
3. Visible competition—multiple parties create urgency
4. No stigma—property still fresh
5. Seller confidence—multiple offers enable strong negotiation
Why Faster Sales Underperform: Limited discovery, rushed decisions, no competition, incomplete market testing. Result: 2.5% less (approximately $25,000-$65,000).
Why Slower Sales Face Penalties: After 60 days, market perception shifts to "problem property," agents stop promoting, buyer stigma develops, severe penalties (−7% to −8%).
Validating Our Findings: Statistical Robustness
To ensure our findings weren't statistical flukes, we validated them using a second method called hedonic regression (a statistical formula that predicts prices based on property characteristics).
What Hedonic Regression Does:
Think of it as creating a mathematical formula that predicts what a property "should" sell for based on its features (bedrooms, bathrooms, land size, location). We then compare actual sale prices to these predictions.
The hedonic regression confirmed our matched cohort findings:
DOM Bucket
Median Residual
What This Means
0-7 days
−1.51%
Sells slightly below predicted value
8-14 days
−1.18%
Sells slightly below predicted value
15-21 days
−1.70%
Sells slightly below predicted value
22-60 days
−2.10%
Baseline
61-90 days
−4.20%
Sells well below predicted value
91-120 days
−4.79%
Sells well below predicted value
121-180 days
−0.06%
Mixed (unique properties)
180+ days
+1.91%
Mixed (unique properties)
What "Residual" Means: The residual is the difference between what the formula predicts and what actually sold. A negative residual means the property sold for less than expected based on its features.
Key Validation: Both methods (matched cohorts and hedonic regression) show the same pattern—properties selling after 60 days achieve significantly lower prices than their characteristics would predict.
Common Objections (And Why They're Wrong)
"But what about unique properties that take longer to find the right buyer?"
This is why we see anomalous results for 121+ day sales—they're fundamentally different properties (acreage, waterfront, architectural homes).
The Evidence:
- 121-180 day sales: Only 16 matched strata (vs 103 for fast sales)
- These properties have unique features that limit buyer pools
- They're not comparable to standard suburban homes
The Lesson: If you're selling a standard suburban home and you're past 60 days, you're not waiting for "the right buyer"—you're losing money.
"What if I just need to wait for the market to improve?"
The data shows the opposite: properties that wait lose value relative to comparable properties selling in the same market conditions.
Why: Market conditions affect all properties equally. The DOM penalty is measured against properties selling in the same time period, so market movements are already accounted for.
"Isn't this just because overpriced properties take longer to sell?"
This is exactly what our matched cohort analysis controls for. We're comparing properties with identical features in the same suburb. The price difference we measure is the cost of time on market, not the cost of overpricing.
However: Overpricing causes long DOM, which then causes the price penalty. So yes, overpricing is the root cause—but the mechanism is time on market.
Practical Recommendations: What to Do
For Sellers: The Sweet Spot Strategy
Pre-Launch: Price for the Sweet Spot
- Research comparable sales from last 3 months
- Price at or slightly below recent comparables
- Goal: Generate strong interest in first week
- Target: Multiple offers in week 3
Week 1: Discovery Phase
- Professional photography and styling
- Launch on all major portals simultaneously
- First open home (Saturday or Sunday)
- Monitor online engagement (views, enquiries)
- Goal: 20+ groups at first open home
Week 2: Evaluation Phase
- Second open home
- Facilitate building inspections for serious buyers
- Provide all documentation (contracts, strata, building reports)
- Monitor buyer feedback from agent
- Goal: 3-5 serious buyers doing due diligence
Week 3: Competition Phase
- Third open home (if needed)
- Set deadline for offers (e.g., "Tuesday 5pm")
- Create competitive tension between buyers
- Negotiate from strength
- Goal: Multiple offers, accept best one
If No Offers by Day 21:
- Immediate price review (not minor adjustment—significant if needed)
- Marketing refresh
- Agent strategy session
- Goal: Generate offers before day 60
If Past Day 60:
- Crisis mode—severe action required
- Options: Major price reduction (10-15%), take off market and re-list, or auction
- Do NOT make minor adjustments—they won't work
For Agents: Setting Client Expectations
At Listing Presentation:
- Show clients this data
- Explain the 15-21 day sweet spot
- Set expectation: "We're pricing to sell in week 3"
- Explain the buyer journey (discovery → evaluation → competition)
- Price accordingly from day one
During Campaign:
- Week 1: "We're building the buyer pool—expect 20+ groups at first open"
- Week 2: "Serious buyers are doing due diligence—this is normal"
- Week 3: "Time to create competition and secure offers"
- If no offers by day 21: Immediate strategy review
- Never let a property drift past 60 days without major intervention
For Buyers: Using This Information
Properties 0-14 Days:
- Property still in discovery phase
- Limited competition yet
- Opportunity to make strong early offer
- But expect seller to wait for week 3 competition
Properties 15-21 Days:
- Optimal window—expect competition
- Seller likely has multiple offers
- Price at or above asking
- Don't lowball—you'll miss out
Properties 22-60 Days:
- Slight negotiation room (2-3%)
- Seller may be getting concerned
- Make reasonable offers
Properties 61+ Days:
- Significant negotiation room (7-10%)
- Seller likely desperate
- Make strategic offers, but don't insult
The Academic Context: Why This Matters
Our findings align with established real estate research:
Signalling Theory (Spence, 1973):
Long time on market signals quality problems to buyers. Even if no actual problems exist, the signal itself affects buyer behaviour and prices.
Search Theory (Lippman & McCall, 1976):
Optimal stopping rules suggest there's a point where continued search costs more than accepting current offers. Our data suggests this point is around 15-21 days.
Real Estate Literature (Anglin et al., 2003):
DOM as a quality signal has been documented in multiple markets. Our contribution is quantifying the specific tipping point (60 days) and magnitude (7-8% penalty) for the Gold Coast market.
The Bottom Line: What This Means for You
The Gold Coast property market rewards strategic timing:
The Myth: "Sell as fast as possible" or "Wait for the perfect buyer"
The Reality:
- Optimal window: 15-21 days — Achieves 4% premium ($40,000-$60,000 extra on $1,000,000)
- Too fast (0-14 days): Leaves $60,000-$100,000 on the table
- Too slow (61+ days): Loses $70,000-$170,000 to market stigma
Why 15-21 Days Works:
1. Sufficient discovery time: Full buyer pool sees the property
2. Multiple inspections: Buyers attend 2-3 viewings before offering
3. Due diligence completed: Buyers are confident and informed
4. Competition develops: Multiple offers push prices up
5. No market stigma: Property still fresh and desirable
The Optimal Strategy:
1. Price to attract strong interest in week 1
2. Facilitate buyer due diligence in week 2
3. Create competitive tension in week 3
4. Accept best offer when multiple buyers are competing
The Data Doesn't Lie:
This isn't opinion or anecdote—it's what actually happened to 44,937 Gold Coast property sales over six years. Properties selling in 15-21 days consistently achieve the highest prices because this timing allows the market to work properly.
The next time someone tells you to "accept the first offer" or "wait for the perfect buyer," ask them: "Have you seen the data on the 15-21 day sweet spot?"
Statistical Methods:
- Matched cohort analysis (stratified comparison)
- Hedonic regression (OLS with property characteristics)
- Median price differences (robust to outliers)
Target Market Context:
- 8 suburbs: Robina, Mudgeeraba, Varsity Lakes, Carrara, Reedy Creek, Burleigh Waters, Merrimac, Worongary
- Median DOM: 27 days
- Mean DOM: 53 days
- Interpretation: In our target market, properties selling in 0-7 days are exceptionally fast (top 20%), whilst properties still on market after 60 days are in the bottom 15%
Analysis conducted February 2026. Property price data sourced from internal database of public property records. Statistical analysis performed using Python with pandas, numpy, and scipy libraries.
Keep reading:Gold Coast market data — prices, supply and selling times, updated as new sales settle.
Disclaimer: The information in this article is for general informational purposes only and does not constitute financial, investment, or valuation advice. Fields Real Estate (Licence No. 4832972) makes no warranty as to the accuracy or currency of data published. Readers should conduct their own due diligence and seek independent professional advice before making any property or investment decision. Read our full disclaimer →
Licensed Queensland real estate agent, founder of Fields Real Estate and Lead Analyst at Fields Research. Covering Gold Coast market data, comparable sales analysis and suburb intelligence.
Where does your own home sit?
Fields keeps a record of every active listing and recent sale across the southern Gold Coast, and reads any address against the sales around it — the comparables, the range they support, and the method behind it. This analysis of the Gold Coast comes from the same database.


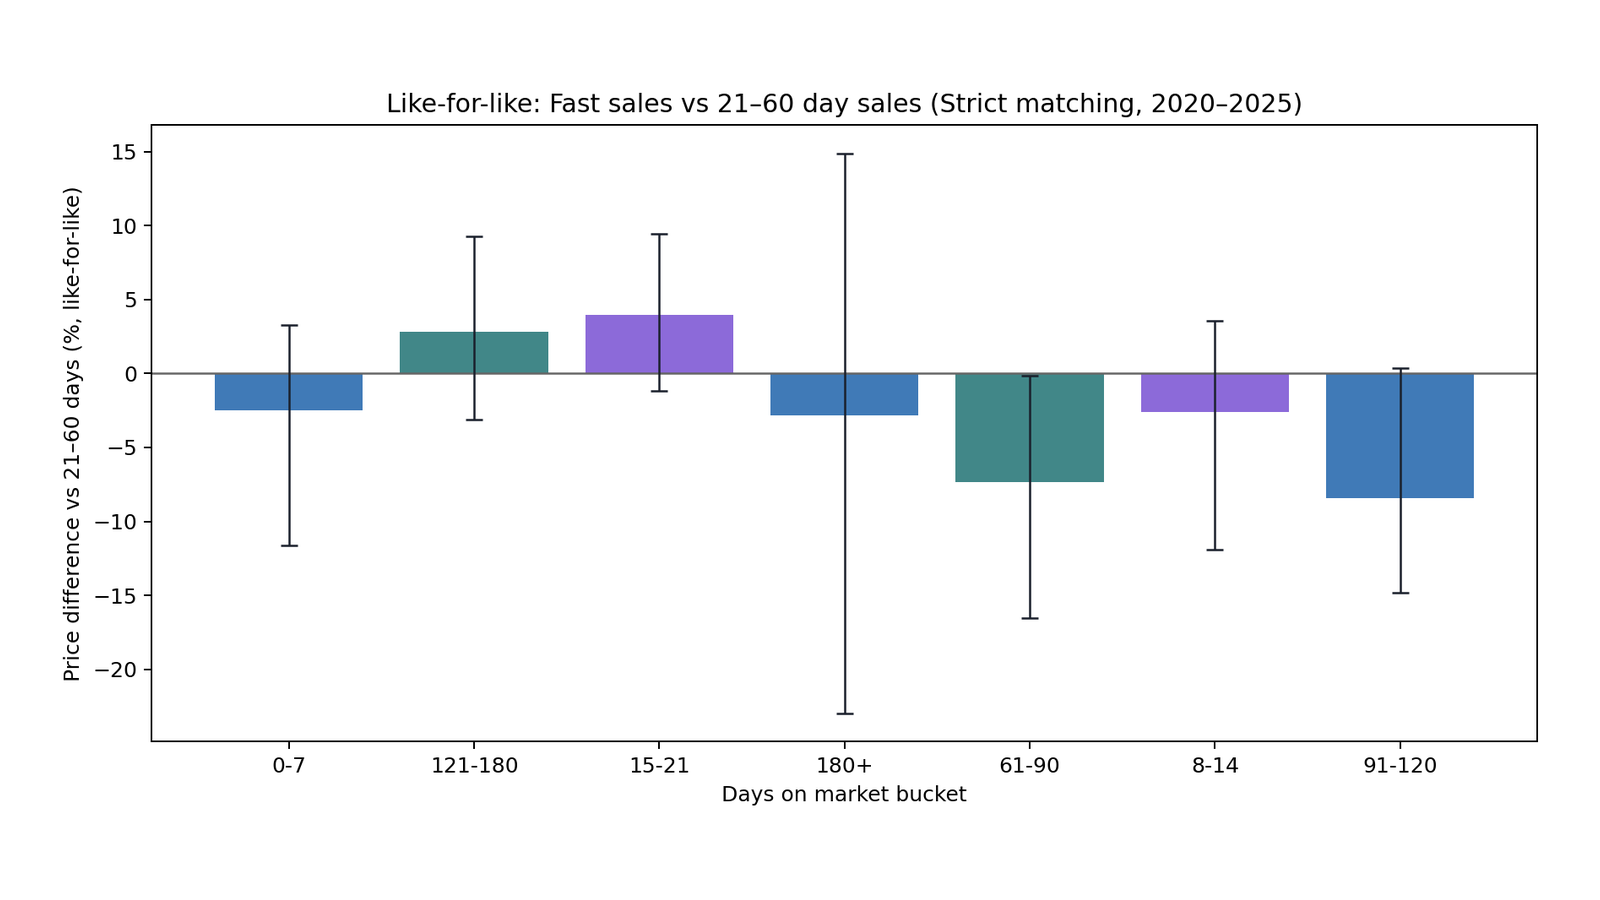

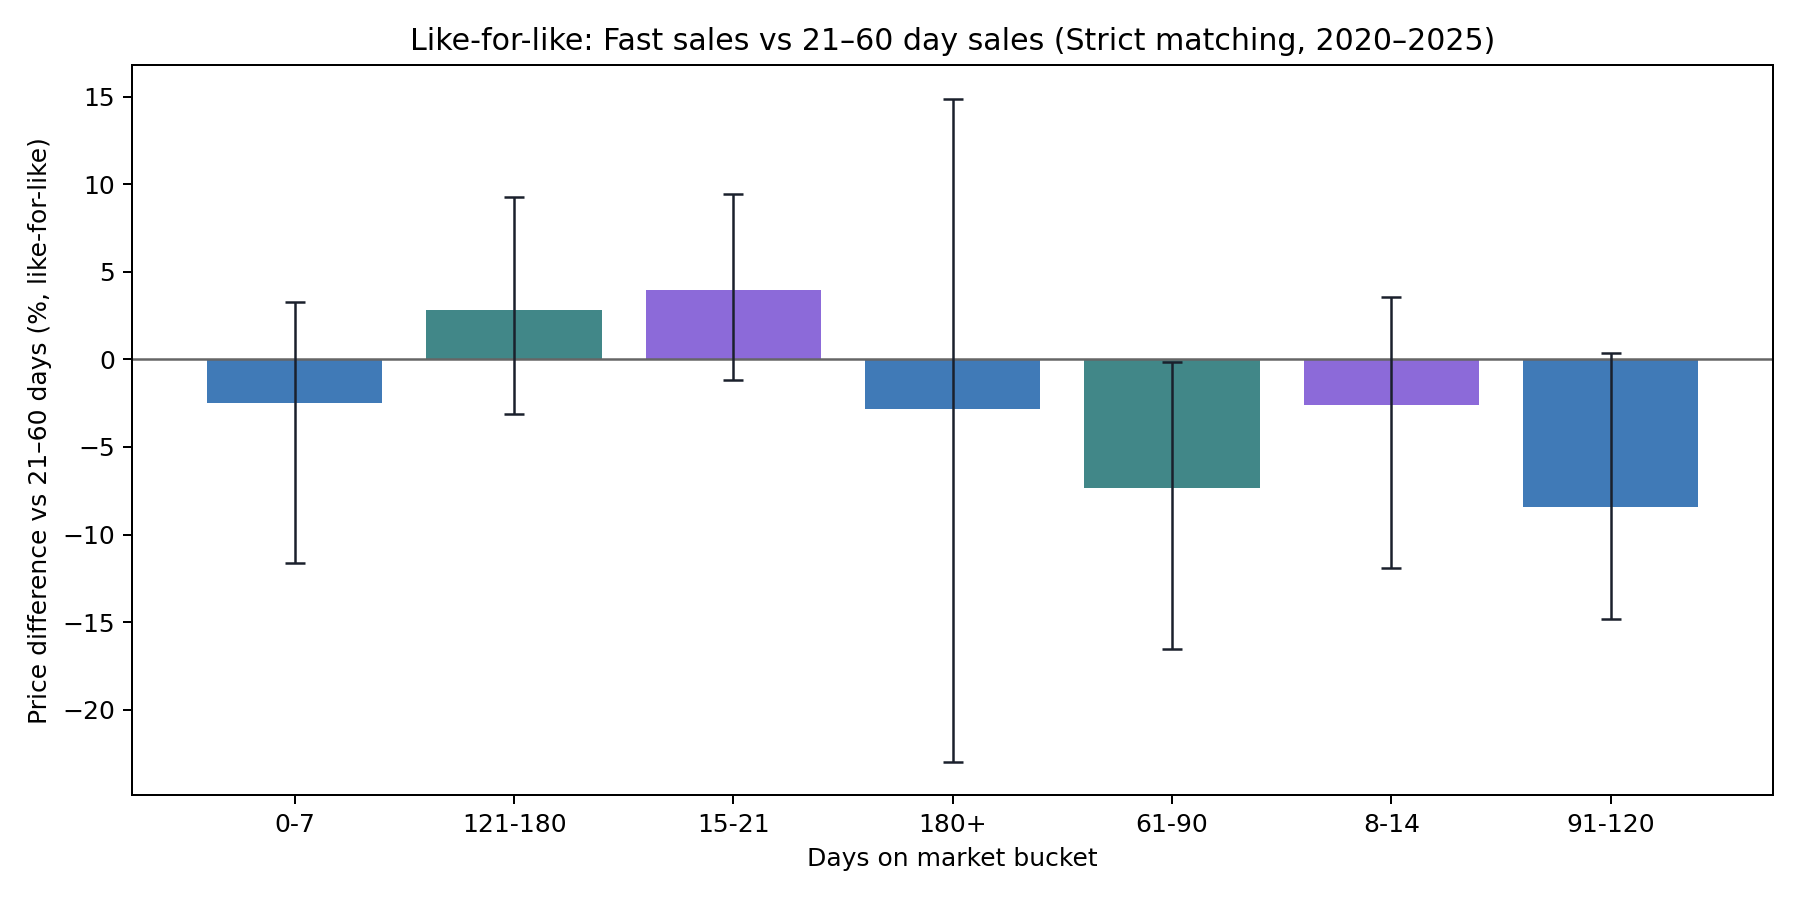 Figure 1: Price premium or discount relative to properties selling in 22-60 days. Notice the 15-21 day sweet spot achieves the highest prices, whilst the dramatic cliff after 60 days shows severe penalties.