Homeowners watching the national headlines could be forgiven for expecting the worst. Nationally, property values fell 0.7% in July — the sharpest monthly drop since the end of 2022 — with Sydney down about 2.0% over the year and Melbourne about 2.8%, both easing more than a per cent again in July alone. On 11 August the Reserve Bank held the cash rate at 4.35% and noted that “momentum in the housing market has shifted, with housing prices falling in some capital cities.”
That downturn is largely a Sydney and Melbourne story, and it has begun to reach further: Brisbane values slipped 0.6% in July, and the Gold Coast’s median eased 0.3% in June — its first fall in about four years. Burleigh Waters is up 6.9% over the year, but of the three suburbs tracked here it is the one where the shorter-term signal has turned: the most recent months of settlements have softened from an April peak, and this update shows how far.
A different suburb from the one next door
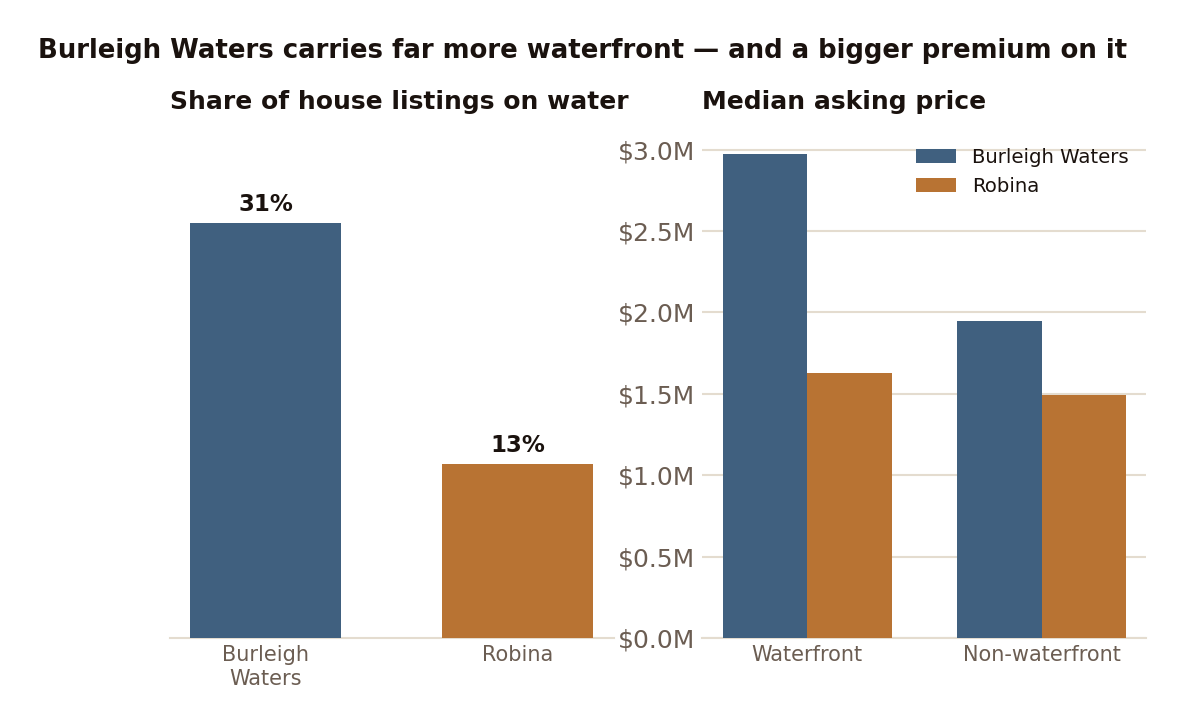
Burleigh Waters and Robina are often discussed together, and they should not be — starting with what is in them. Of the houses currently for sale in Burleigh Waters, 31% front water; in Robina it is 13%. The premium on that water is far larger here, too: waterfront houses are advertised at a median well above $2,900,000 against under $2,000,000 for non-waterfront, while in Robina the two sit close together. Burleigh Waters listings run to $5,995,000; Robina’s ceiling is $2,750,000.
A suburb with a large, expensive waterfront tier carries a higher median and a much wider spread of prices — and its top and bottom ends do not always move together.
Burleigh Waters carries more than twice Robina's share of waterfront houses — and a far larger premium on them.
The year-on-year picture: up, and flatter than it was
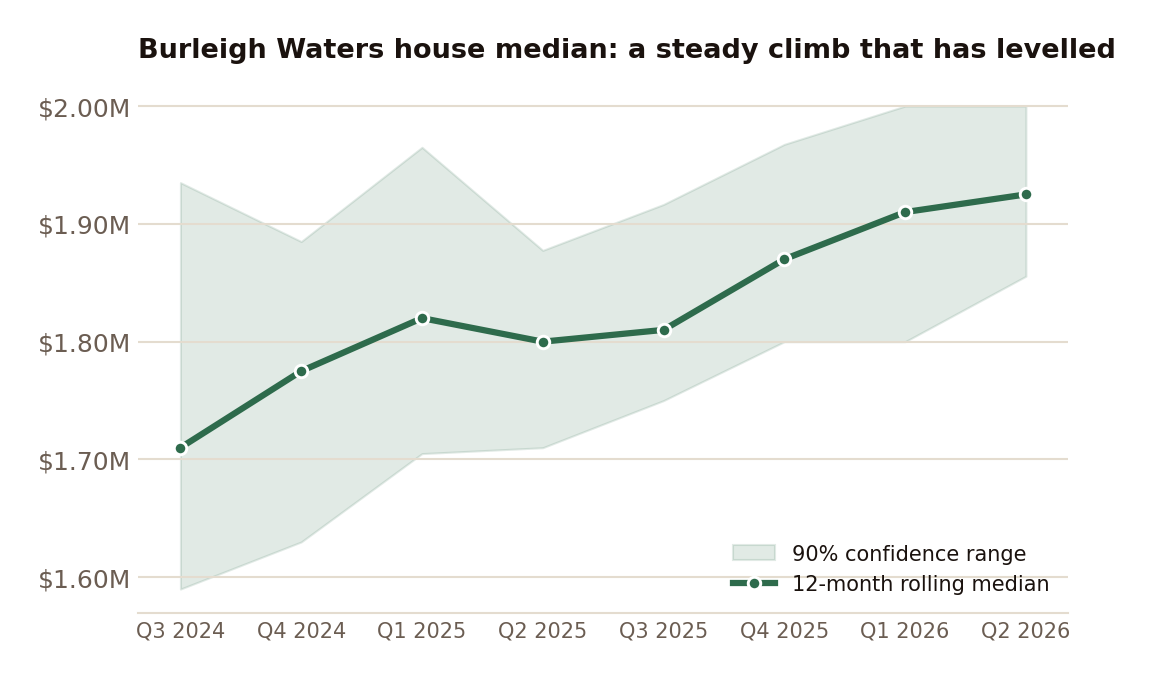
Over the twelve months to August, the median Burleigh Waters house sold for $1,925,000, up 6.9% on the year before, when it was $1,800,000 — 167 sales, margin 3.9%. The twelve-month trend has been a steady climb that has recently levelled:
The twelve-month rolling median: a steady climb that has recently levelled at $1.925M.
The last three months tell a sharper story
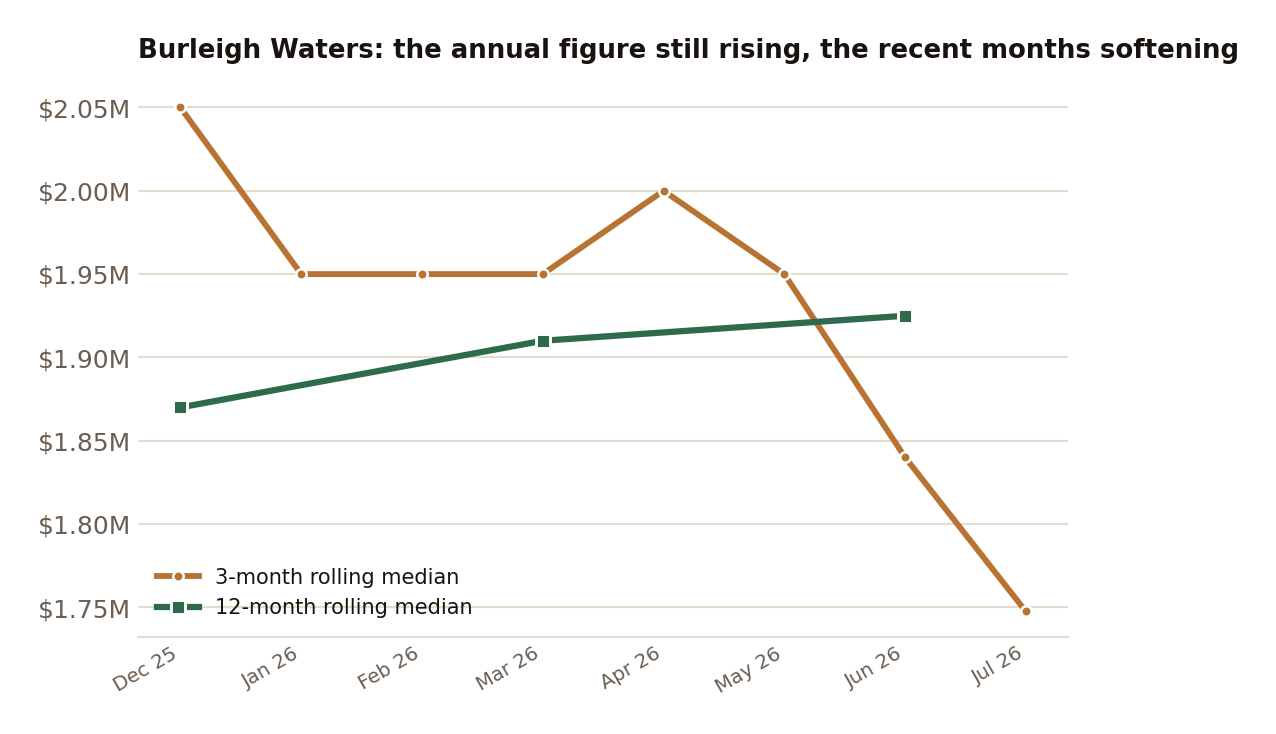
A twelve-month median pools a full year of sales, which makes it steady and makes it slow to register a turn. A three-month window catches movement the annual figure has not yet absorbed — and in Burleigh Waters it shows one. On a rolling three-month basis the median peaked at $2,000,000 in the three months to April and has eased each month since, to about $1,750,000 by July — a step down of roughly 11–13% in a single quarter.
A three-month median is less certain than a twelve-month one: each reading rests on around fifty sales rather than a hundred and sixty, so its margin of error is wider. Two things give this weight anyway. The fall is larger than that uncertainty — the range around the April figure and the range around July’s do not overlap, so it is a genuine move rather than a wobble. And it lines up with the wider market: Cotality recorded Brisbane values falling in July, PropTrack recorded the Gold Coast median easing 0.3% in June, and the Reserve Bank flagged the same shift on 11 August.
Two caveats: the most recent month is excluded from the chart, because sales settle and register with a lag and the latest month is always incomplete; and a three-month median is a responsive early read, not a verdict — it has turned before and turned back. The year-on-year picture is flat-to-up; the most recent quarter of settlements has softened from the April peak. Both hold, which is why more than one measure is on the page.
The annual figure is still rising while the three-month median has fallen from its April peak — the recent softening the yearly number has not yet absorbed.
Time to sell improved, then ticked back up
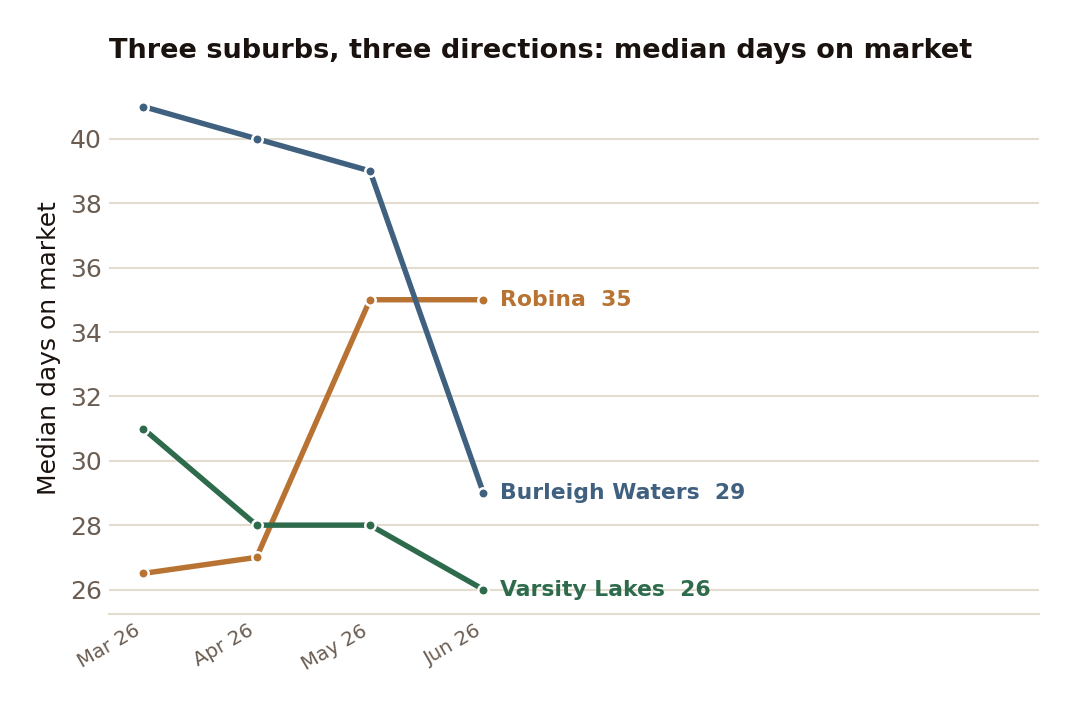
Speed of sale tracks the same arc. In the June quarter the median Burleigh Waters house sold in 29 days, against 37 a year earlier — the share selling within a month rose to 51.3%, and the share taking longer than ninety days fell to 5.1%. PropRadar puts the June-quarter figure at 33 days. But the most recent reading has softened in step with the price: on a rolling three-month basis, the median edged back toward the low forties of days through July. The improvement through autumn was real, and it has begun to give some of itself back — the opposite of Robina, six kilometres inland, where the median has lengthened steadily all year.
The most consistent explanation across the wider market is about how buyers are funded, not where they look. Three rate rises through 2026 have cut borrowing capacity by around 7% since January, which weighs most on buyers borrowing near their limit and least on those buying with equity or cash. Industry commentary describes the same split: mortgage-dependent buyers, concentrated in the mid-market, have stepped back, while downsizers, self-funded retirees and equity-rich relocators — more common at the coastal end — remain active. Interstate migration into Queensland is still positive but has slowed, down about a quarter in the year to June 2025. This is a mechanism drawn from national data and commentary rather than something measurable sale by sale in these suburbs, but it fits the local figures.
Median days on market, three-month rolling — Burleigh Waters and Robina moving in opposite directions.
More choice here than in the other suburbs
Burleigh Waters currently has 60 homes advertised — 35 houses and 24 attached dwellings. That stock would take 3.57 months to clear at the current rate, against 2.18 in Robina and 1.77 in Varsity Lakes. Four months is generally treated as balanced, so Burleigh Waters is the closest of the three to it. Residential vacancy, at 2.73%, is the highest of the three — four times Varsity Lakes’. Brisk sales alongside more available stock is not a contradiction: a market with a wide range of home types can turn over its in-demand stock while holding plenty of choice at other price points.
On the street
Two Burleigh Waters houses on the market this month sit at opposite ends of it.
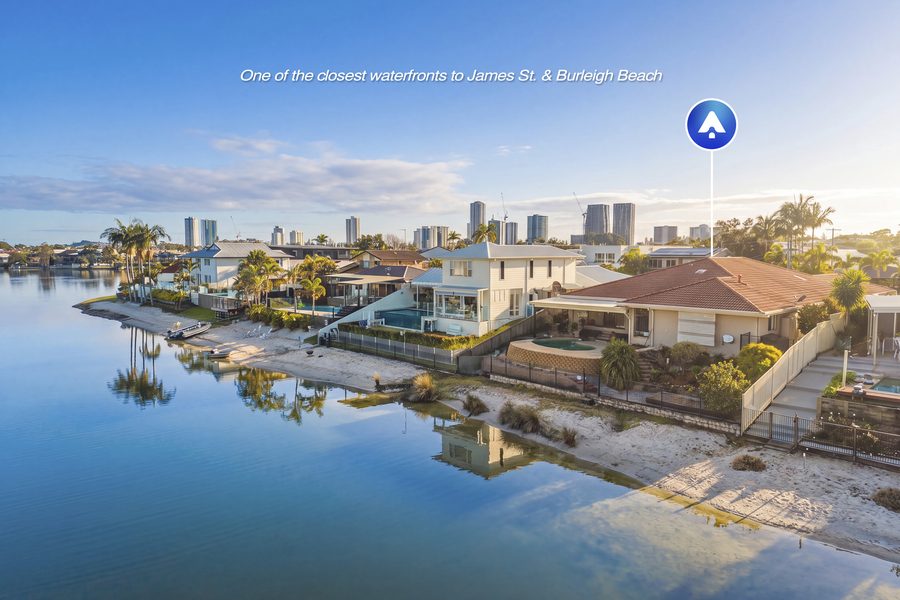
47 Kingfisher Crescent, Burleigh Waters — a five-bedroom waterfront home, listed at offers over $2,750,000.
47 Kingfisher Crescent, a five-bedroom waterfront home, was listed about three weeks ago inviting offers over $2,750,000.
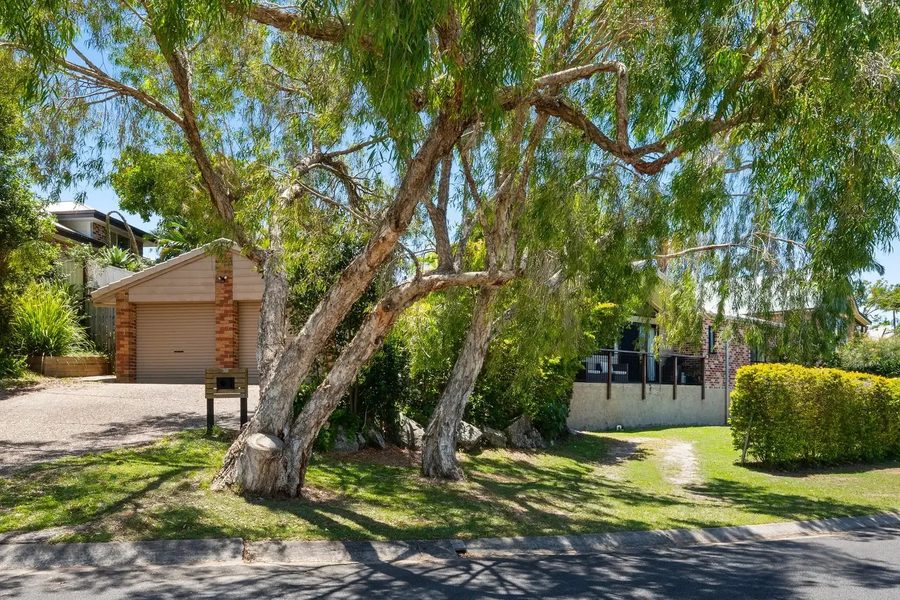
38 Beaconsfield Drive, Burleigh Waters — a six-bedroom home listed about seven months, at offers over $2,100,000.
38 Beaconsfield Drive, a large six-bedroom home a short distance from the water, has been advertised for around seven months, currently at offers over $2,100,000.
Neither has sold yet, so neither has a result to report — but the contrast is the point. In the same suburb, in the same month, an in-demand waterfront home tests the market fresh while a larger non-waterfront home works through a long campaign. The suburb’s headline figures are the average of that spread, and describe neither home on its own.
Units are a separate, and striking, story
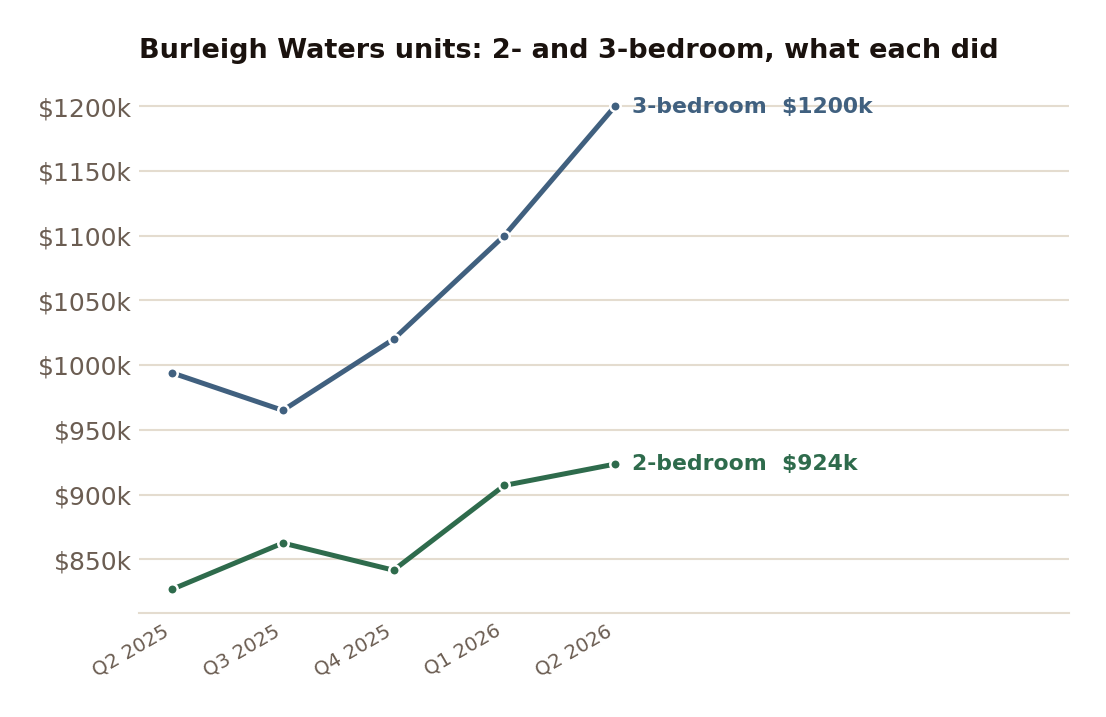
Attached dwellings — units, townhouses and villas — reached a twelve-month median of $1,052,500, up 22.4% year-on-year, more than three times the growth of houses and the largest single number in this quarter’s data. Most of it, though, is not what it appears. By bedroom, attached dwellings did this over the year:
Two bedrooms: $907,000 → $923,500
Three bedrooms: $1,100,000 → $1,200,000
Neither is close to 22%. The combined median rose faster than either size because the mix shifted — more three-bedroom dwellings sold this year than two years ago, and larger dwellings cost more, so the middle of the list moved up. The 22.4% describes the middle dwelling that sold, not how much any given unit appreciated; for a two-bedroom owner the figure is closer to 2%. It is the clearest local example of a trap that affects every median, covered in full in the companion article on comparing median prices.
Burleigh Waters attached dwellings, two- and three-bedroom — the detail behind the 22.4% headline.
What the data does not support
A single-quarter house price move is left out: of the last nine quarterly medians, only one rests on a large enough sample to be reliable, with the others carrying margins as wide as 38.7%. Sales volume is left out too — two transaction series disagree on the direction of activity, and one previously produced a figure that had to be retracted.
On that: until 1 August, the Burleigh Waters house median was calculated by a method anchored to an external dataset, and it read $2,115,000, up 23.6%. That method drew on a different population of houses than the one being reported. Rebuilt from the underlying transaction records, the same suburb over the same period reads $1,925,000, up 6.9%. The earlier figures are withdrawn — and every median chart now names which homes it counts.
The longer view
Burleigh Waters house prices have risen 153.2% since the September quarter of 2016, when the median was $707,000 — the strongest long-run growth of the three. Against that, a year that added 6.9% and a quarter that gave a little of it back are small movements. Where prices go next is not something the data can settle, and this update does not forecast it.
Sources: Fields Estate transaction data for Burleigh Waters, twelve months to 2 August 2026, compiled from public sale records. Days-on-market (the days_on_market field, as published on the Market Intelligence pages) and supply/vacancy cross-checked against PropRadar. National and regional context: Cotality Home Value Index July 2026; PropTrack, June 2026; Reserve Bank of Australia media release 2026-19, 11 August 2026; ABS interstate migration to June 2025. Sample sizes and confidence intervals are on the Burleigh Waters Market Intelligence page. Listing counts as at 20 August 2026.
Licensed Queensland real estate agent, founder of Fields Real Estate and Lead Analyst at Fields Research. Covering Gold Coast market data, comparable sales analysis and suburb intelligence.
Where does your own home sit?
Fields keeps a record of every active listing and recent sale across the southern Gold Coast, and reads any address against the sales around it — the comparables, the range they support, and the method behind it. This analysis of the Gold Coast comes from the same database.