What do comparable sales say about your home?Your home vs recent sales
Enter your address to see the comparable sales around it. Free, no sign-up.Free comparable sales for your address.
🔍
Analyst21 August 2026·Updated 15 September 2026·5 min read
The fundamentals of the Brisbane market — and what they mean for the Gold Coast
Brisbane rose 14.8% over the year, then fell for two months. Both are true — the long-run case and the short-run turn run on different clocks. What it means for the Gold Coast.
Brisbane has been one of the country’s great property stories. Over the year to July 2026, dwelling values across the city rose 14.8% — while Sydney and Melbourne went backwards. Over the past two months, Brisbane values have fallen.
Both of those are true, and holding them together is the only honest way to read this market. The long-run case for Brisbane is intact; the short-run picture has turned. They are not in conflict — they run on different clocks.
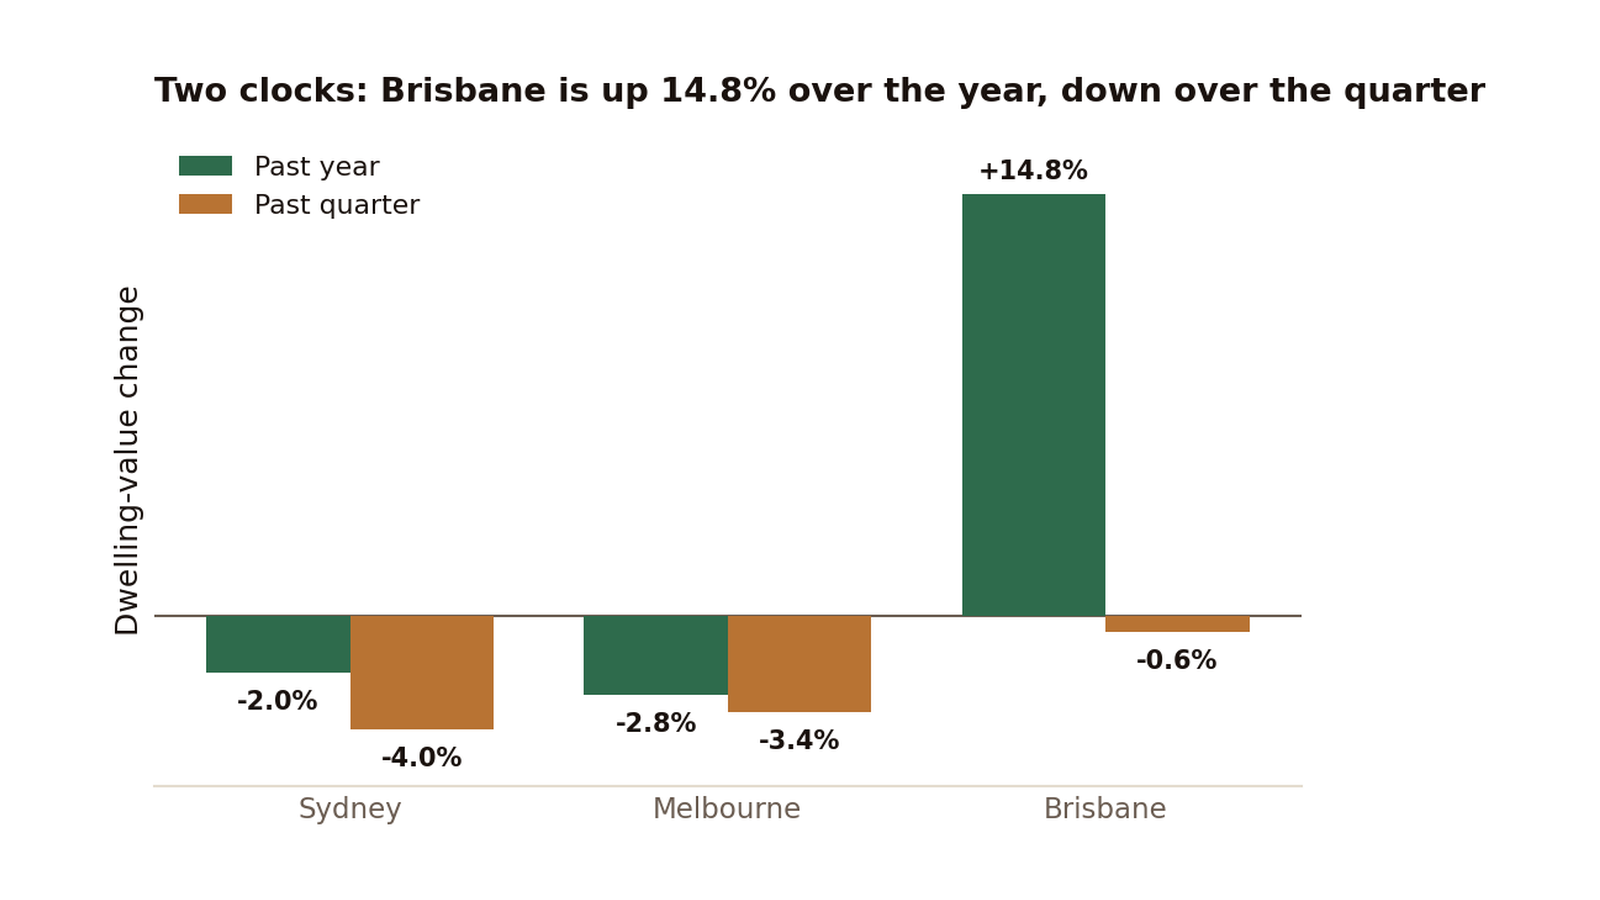
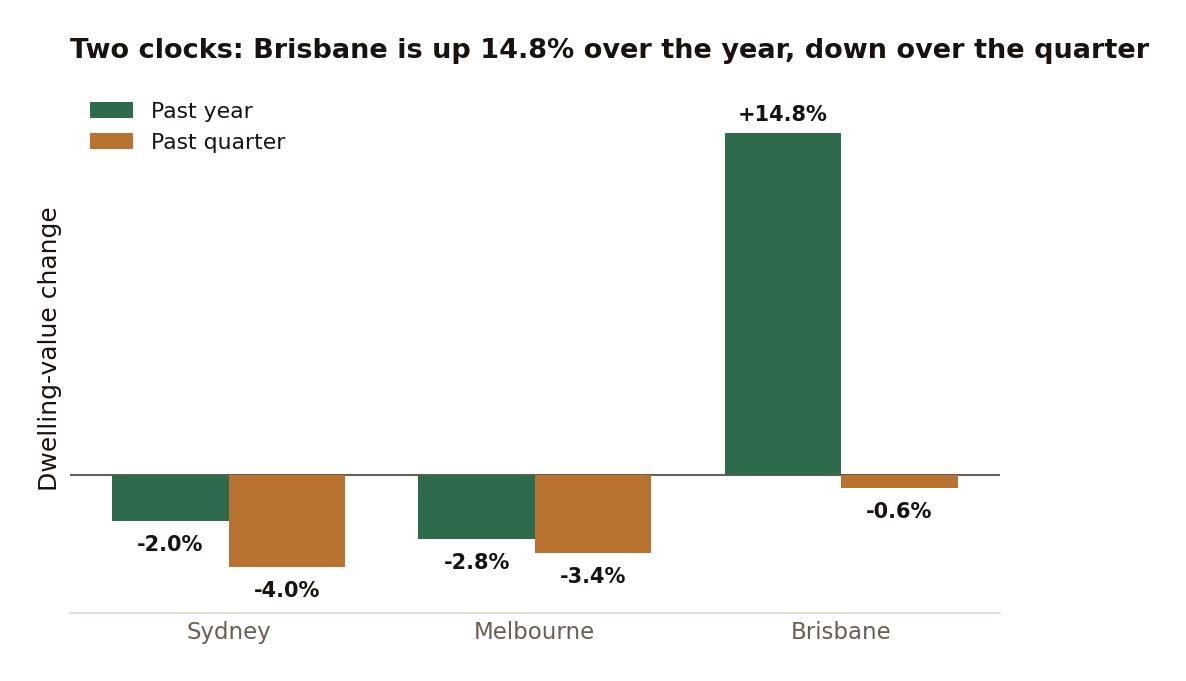
Brisbane rose 14.8% over the past year while Sydney and Melbourne fell — but over the most recent quarter Brisbane slipped 0.6%. The annual figure and the quarterly figure describe the same city on two different timescales. (Cotality, formerly CoreLogic, July 2026.)
The ten-year story
For most of the past five years Brisbane has been pulled upward by forces that have not gone away.
Queensland continues to draw people from the southern states, and South East Queensland absorbs the largest share of that migration. New housing has not kept pace: construction costs have risen sharply, approvals have lagged population growth, and rental vacancy has sat near one per cent — a level that describes a genuine shortage rather than a tight patch. And the 2032 Olympics has attached a decade-long infrastructure program to the region, the kind of sustained public investment that tends to underwrite land values well beyond the event itself.
That is the story most commentary about Brisbane tells, and it is a reasonable one. It is also the basis for the forecasts. ANZ, for instance, has forecast Brisbane values to rise strongly again across 2026 before moderating in 2027 as affordability bites. Forecasts are not facts — this year has been a lesson in how quickly they change — but the structural argument beneath them is sound: more people, not enough homes, and a decade of construction ahead.
The ten-month story
Against that backdrop, the recent numbers read as a genuine shift.
Brisbane dwelling values fell 0.6% in July, the second consecutive monthly decline, and were down 0.6% across the quarter. The stock of homes for sale has climbed — total listings are up almost 15% on a year ago — which gives buyers more choice and takes some urgency out of the market. Auction clearance rates, at around 37% in early August, have recovered from a low earlier in winter but remain well below the 67% of a year ago. And on 11 August the Reserve Bank, holding the cash rate at 4.35%, noted that “momentum in the housing market has shifted, with housing prices falling in some capital cities.”
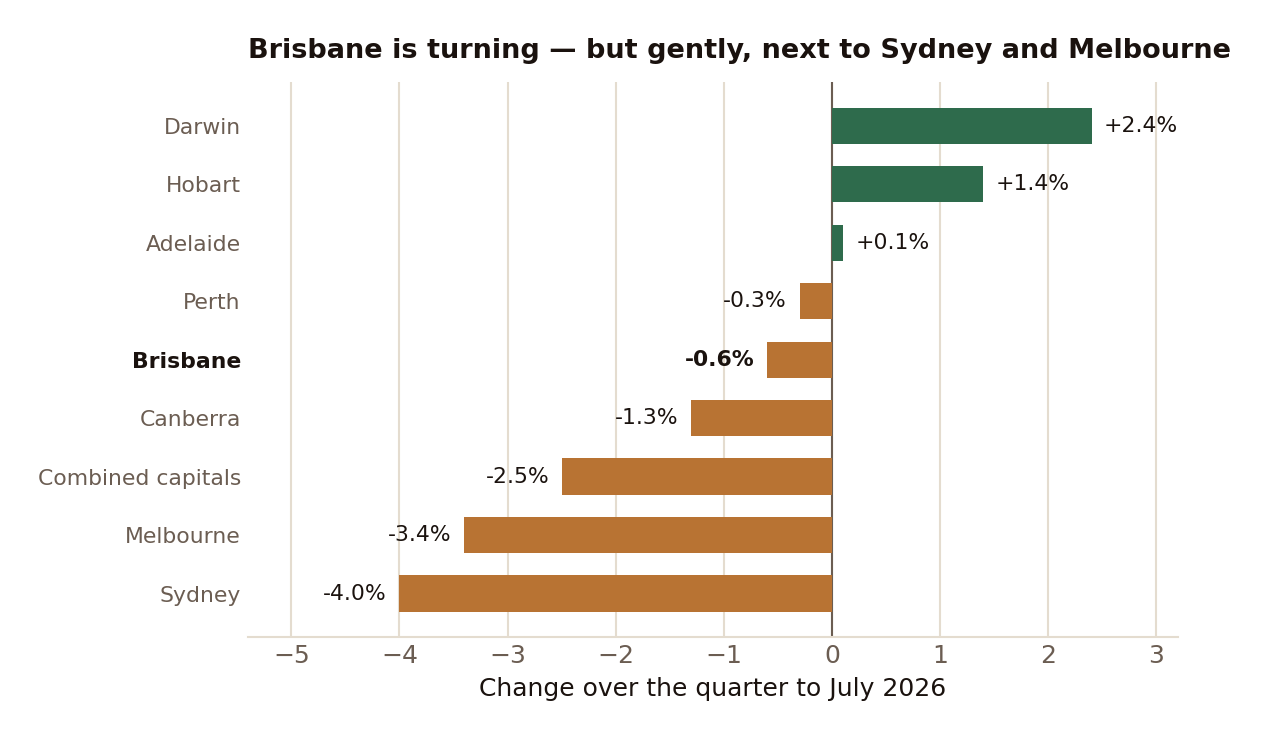
Importantly, Brisbane’s fall is mild next to the two largest cities. Over the quarter Sydney dropped 4.0% and Melbourne 3.4%; Brisbane gave up 0.6%. The national downturn is real, but it is concentrated in the south.
Quarterly change in dwelling values by capital city. The downturn is led by Sydney and Melbourne; Brisbane's decline is modest, and the smaller capitals are still rising. (Cotality, July 2026.)
Why the two clocks do not contradict each other
An annual figure pools twelve months of sales, so it still carries most of last year’s strength; it moves slowly and lags a turning point. A quarterly figure is more responsive and picks up the recent softening first. When a market rises hard for most of a year and then eases, the annual number stays high while the quarterly number turns negative — which is exactly what Brisbane’s +14.8% and −0.6% are showing.
So the honest reading is neither “Brisbane is booming” nor “Brisbane is falling.” It is a market that rose a long way and has recently come off the boil, with the structural supports for the longer term still in place. Which of those two facts matters more to you depends entirely on your timeframe — whether you are looking at the next decade or the next six months.
What it means for the Gold Coast
The Gold Coast is a separate market with its own dynamics, but it sits in the same weather system as Brisbane. It shares the South East Queensland tailwinds — interstate migration, an undersupply of housing, and the Olympics-linked infrastructure spend — and, right now, it shares the softening tail: the Gold Coast’s own median eased 0.3% in June, its first fall in about four years.
What the Gold Coast does not share is a single direction. Beneath the regional figure, individual suburbs are moving differently from one another — some faster, some slower, some flat — which is why a citywide number tells a homeowner very little about their own street. Our suburb updates for Robina, Varsity Lakes and Burleigh Waters set out where each of those markets actually sits, and our companion piece on whether the market is about to fall works through the difference between a market that is slowing and one that is falling apart.
The short version: Brisbane’s fundamentals are the Gold Coast’s fundamentals, and they remain strong for the long term. The near-term signal has softened across South East Queensland. Both are true at once.
Sources: Cotality (formerly CoreLogic) Home Value Index, July 2026, published 3 August 2026; auction and listings data via Cotality and SQM Research; ANZ Research housing forecasts; Reserve Bank of Australia media release 2026-19, 11 August 2026; ABS interstate migration. Gold Coast median: PropTrack, June 2026. Figures as at publication.
Keep reading:Gold Coast market data — prices, supply and selling times, updated as new sales settle.
Licensed Queensland real estate agent, founder of Fields Real Estate and Lead Analyst at Fields Research. Covering Gold Coast market data, comparable sales analysis and suburb intelligence.
Where does your own home sit?
Fields keeps a record of every active listing and recent sale across the southern Gold Coast, and reads any address against the sales around it — the comparables, the range they support, and the method behind it. This analysis of the Gold Coast comes from the same database.