What do comparable sales say about your home?Your home vs recent sales
Enter your address to see the comparable sales around it. Free, no sign-up.Free comparable sales for your address.
🔍
Analyst11 March 2026·Updated 15 September 2026·10 min read
What Really Drives Gold Coast House Prices? The Data Might Surprise You
Infrastructure spending, population migration, and interest rates all get blamed for property price movements. We analysed 10 years of Gold Coast data to find out which factors actually correlate.
Last Edit: 11/02/2026, 7:54 AM (Tuesday) — Brisbane Time
Everyone watches interest rates, but they're watching the wrong thing. Our analysis of 27 economic datasets across 8 Gold Coast suburbs reveals which indicators moved ahead of price movements—and why the RBA is always 12 months behind the market.
The Myth vs. The Reality
Ask any homeowner what drives house prices, and you'll likely hear the same answers: interest rates, population growth, and supply shortages. While these factors matter, our comprehensive analysis of 10 years of Gold Coast property data tells a different story—one that could change how you think about your next property decision.
We analysed 194 correlation relationships between economic indicators and median house prices across 8 Gold Coast suburbs from 2015 to 2025. The results challenge conventional wisdom and reveal which factors actually predict price movements.
The Surprising Truth: What Really Moves Prices
Complete Rankings: All 8 Economic Indicators
Figure 1: Correlation strength of economic indicators with Gold Coast house prices across 8 suburbs
Here's how all the indicators stack up, ranked by correlation strength:
Rank
Economic Indicator
Correlation
Time Lag
Observed lead or lag
1
Total Bank Lending (Credit Volume)
r = 0.948
-1.4Q (lags)
Confirms past movements
2
Wage Price Index QLD
r = 0.940
+1.4Q (leads)
Predicts 3-4 months ahead
3
Household Spending QLD
r = 0.914
0Q (real-time)
Current market strength
4
Household Spending AUS
r = 0.871
0Q (real-time)
Broader economic context
5
RBA Cash Rate (Interest Rates)
r = 0.791
-4.0Q (lags)
12 months behind
6
Job Vacancies
r = 0.744
0Q (real-time)
Employment strength
7
Company Profits
r = 0.712
0Q (real-time)
Business cycle health
8
Retail Turnover QLD
r = 0.672
+1.8Q (leads)
Predicts 4-5 months ahead
Important Distinction: "Total Bank Lending" (#1) measures the total volume of credit in the economy—how much money banks are lending overall. This is different from "Interest Rates" (#5), which is the RBA's cash rate. While lending volume has the highest correlation, it lags prices by 3.5 months. Interest rates lag even further at 12 months.
Why Household Spending Matters Most
The standout finding? Queensland household spending emerged as the single strongest predictor of Gold Coast house prices, with an average correlation of r = 0.914 across all suburbs studied.
This makes intuitive sense when you think about it: when people feel confident enough to spend money on goods and services, they're also confident enough to make major property decisions. Consumer confidence isn't just a feel-good metric—it's a leading indicator of housing market strength.
Burleigh Waters showed the strongest response to household spending (r = 0.936), while even the least sensitive suburb, Worongary (r = 0.862), still demonstrated a very strong relationship.
Why Interest Rates Are the Wrong Thing to Watch
Interest rates DO correlate strongly with Gold Coast house prices—our analysis found r = 0.791 across all 8 suburbs studied, ranking them #5 out of 8 economic indicators. But here's the problem: interest rate changes lag house prices by 12 months.
This means:
- Prices rise in Q1 2024
- RBA raises rates in Q1 2025
- By the time you see rate rises, the price movement has already happened
The RBA is chasing the market, not leading it. Interest rates are a confirming indicator, not a predictive one.
What most people think: "RBA cuts rates → Prices will rise → I should buy" What the data shows: "Prices rise → 12 months later → RBA raises rates → Market has already moved"
Even more revealing: lending and credit aggregates lag house prices by 3.5 months (r = 0.948). Credit expansion follows price increases—it doesn't cause them.
The implication? By the time you see rate cuts or credit growth accelerating, savvy investors have already acted. If you want indicators that LEAD prices behave differently from those that lag them.
The Real Leading Indicator: Wages
The indicator with the longest lead time in our analysis was the Wage Price Index for Queensland. Over the period measured, it led house prices by approximately 1.4 quarters (3-4 months).
In the period we measured, movements in wage growth were followed by movements in house prices 3-4 months later. That is a historical relationship in our dataset, not a forecast: a lead observed in past data may or may not hold in future.
Practical Application
Wage Trend
What It Signals
What the data showed historically
Rising for 2+ quarters
Market strengthening
In our dataset, price growth followed 3-4 months later
Plateauing
Market stabilising
No consistent directional signal in our dataset
Declining
Potential softening ahead
In our dataset, price softening followed 3-4 months later
Suburb-by-Suburb Sensitivity
Not all Gold Coast suburbs respond equally to economic conditions. Our analysis revealed distinct patterns:
Most Economically Sensitive Suburbs
Burleigh Waters emerged as the most responsive to economic changes:
- Household Spending correlation: r = 0.936
- Company Profits correlation: r = 0.765
- Housing Finance correlation: r = 0.742
This premium beachside market moves in lockstep with broader economic conditions—great for gains in good times, but potentially more volatile during downturns.
Mudgeeraba and Robina showed similarly strong economic sensitivity, making them reliable barometers of Gold Coast market health.
Most Insulated Suburb
Worongary demonstrated the lowest correlations across most indicators:
- Household Spending: r = 0.862 (still strong, but lowest)
- Housing Finance: r = 0.596
Its hinterland location appears to provide some insulation from economic cycles—potentially attractive for buyers seeking stability over maximum growth.
What This Means for You
For Buyers
Watch wages, not just rates. Queensland wage growth is your best 3-4 month preview of where prices are heading.
Don't chase credit growth. By the time lending is accelerating, prices have already moved.
Consider suburb sensitivity. If you want stability, look at hinterland suburbs. If you want to ride economic upswings, coastal suburbs like Burleigh Waters offer more leverage.
For Sellers
Time with consumer confidence. Strong household spending data suggests buyers are confident and willing to pay.
Beachside suburbs respond fastest. If economic indicators are positive, premium coastal suburbs will likely see price gains first.
Watch for wage growth slowdowns. A deceleration in wage growth today could signal softer conditions 3-4 months out.
For Investors
The data suggests a simple monitoring framework:
Indicator
Signal
Timing
Wage Price Index ↑
Price growth followed, in our dataset
3-4 months ahead
Household Spending ↑
Market currently strong
Real-time
Credit Growth ↑
Confirms recent price gains
3-4 months behind
The Bottom Line
The Gold Coast property market is driven more by consumer confidence and wage growth than by the interest rate movements that dominate headlines. Our analysis of 27 economic datasets across 8 suburbs over 10 years reveals that:
Household spending is the #1 real-time indicator of market strength (r = 0.914)
Wage growth leads prices by 3-4 months—the longest lead we measured (r = 0.940)
Interest rates lag prices by 12 months—the RBA is reactive, not predictive (r = 0.791)
Suburb sensitivity varies significantly—from highly responsive Burleigh Waters to more insulated Worongary
The next time someone tells you to wait for interest rate cuts before buying, remember: by the time the RBA moves, the market has already moved. Watch Queensland wage growth instead—it leads prices by 3-4 months.
Academic Validation
Our findings are consistent with peer-reviewed research on Australian house prices. Abelson, Joyeux, Milunovich and Chung (2005), in a study published in The Economic Record, analysed 33 years of national house price data (1970–2003) using cointegration and error correction models. Their key findings align with ours:
Finding
Their Result (National, 1970–2003)
Our Result (Gold Coast, 2015–2025)
Income is the strongest positive driver
Real disposable income elasticity of 1.71 — a 1% income rise produces a 1.71% house price rise
Wage Price Index leads prices by 3–4 months with r = 0.940 correlation
Interest rates are weaker than income
Mortgage rate sensitivity of -0.054 per percentage point — significant but far smaller than the income effect
Interest rates ranked #5 of 8 indicators and lag prices by 12 months
Consumer confidence matters
CPI (their confidence/inflation proxy) elasticity of 0.76; unemployment elasticity of -0.19
Household spending correlation of r = 0.914 — the strongest real-time indicator
Prices adjust asymmetrically
Rising markets adjust to equilibrium in ~4 quarters; falling markets take ~6 quarters (50% slower)
Not tested in our dataset — but consistent with the absence of sharp price drops in Gold Coast quarterly data
Housing supply is a major factor
Housing stock per capita elasticity of -3.6 — the largest single coefficient in their model
We track dwelling completions as a market signal but have not yet tested the correlation formally
The Abelson et al. study adds two findings that extend our analysis. First, the income amplification effect: house prices don't just track income — they amplify it. A 1% rise in real disposable income per capita produces a 1.71% rise in house prices. This means even moderate wage growth (such as the current 3.3% in Queensland) drives disproportionate price gains. It also means when wages fall, the downside is amplified.
Second, Australian house prices are structurally resistant to sharp crashes. Their asymmetric error correction model shows that when prices are rising, the market adjusts to new equilibrium in approximately four quarters. When prices are falling or flat, the adjustment takes six quarters — 50% slower. This "sticky downward" behaviour means Australian housing markets tend to stagnate rather than crash, giving sellers and policymakers time to respond. This structural feature has held across four distinct boom-bust cycles over 33 years.
Where our analysis goes further: Abelson et al. used national aggregates and did not test lead-lag timing explicitly. Our suburb-level analysis reveals that sensitivity varies significantly across the Gold Coast — Burleigh Waters is the most economically responsive suburb while Worongary is the most insulated — and that wage growth specifically leads prices by 3–4 months, a lead relationship rather than a merely concurrent correlation.
Reference: Abelson, P., Joyeux, R., Milunovich, G. and Chung, D. (2005), 'Explaining House Prices in Australia: 1970–2003', The Economic Record, Vol. 81, No. 255, pp. S96–S103.
Methodology Note
This analysis examined 27 economic datasets: 26 from the Australian Bureau of Statistics (ABS) including employment, wages, inflation, credit, construction, housing finance, company profits, and household spending data, plus 1 from the Reserve Bank of Australia (RBA cash rate).
Correlations were calculated against quarterly median house prices for 8 Gold Coast suburbs (Robina, Mudgeeraba, Varsity Lakes, Reedy Creek, Burleigh Waters, Merrimac, Worongary, and Carrara) from Q1 2015 to Q4 2025.
Time-lag analysis tested correlations at ±4 quarter offsets to identify leading and lagging relationships. All data sources are publicly available from the ABS and RBA.
Data analysis conducted December 2025 - February 2026. Property price data sourced from internal database. Economic indicators from Australian Bureau of Statistics and Reserve Bank of Australia.
Keep reading:Gold Coast market data — prices, supply and selling times, updated as new sales settle.
Disclaimer: The information in this article is for general informational purposes only and does not constitute financial, investment, or valuation advice. Fields Real Estate (Licence No. 4832972) makes no warranty as to the accuracy or currency of data published. Readers should conduct their own due diligence and seek independent professional advice before making any property or investment decision. Read our full disclaimer →
Licensed Queensland real estate agent, founder of Fields Real Estate and Lead Analyst at Fields Research. Covering Gold Coast market data, comparable sales analysis and suburb intelligence.
Where does your own home sit?
Fields keeps a record of every active listing and recent sale across the southern Gold Coast, and reads any address against the sales around it — the comparables, the range they support, and the method behind it. This analysis of the Gold Coast comes from the same database.


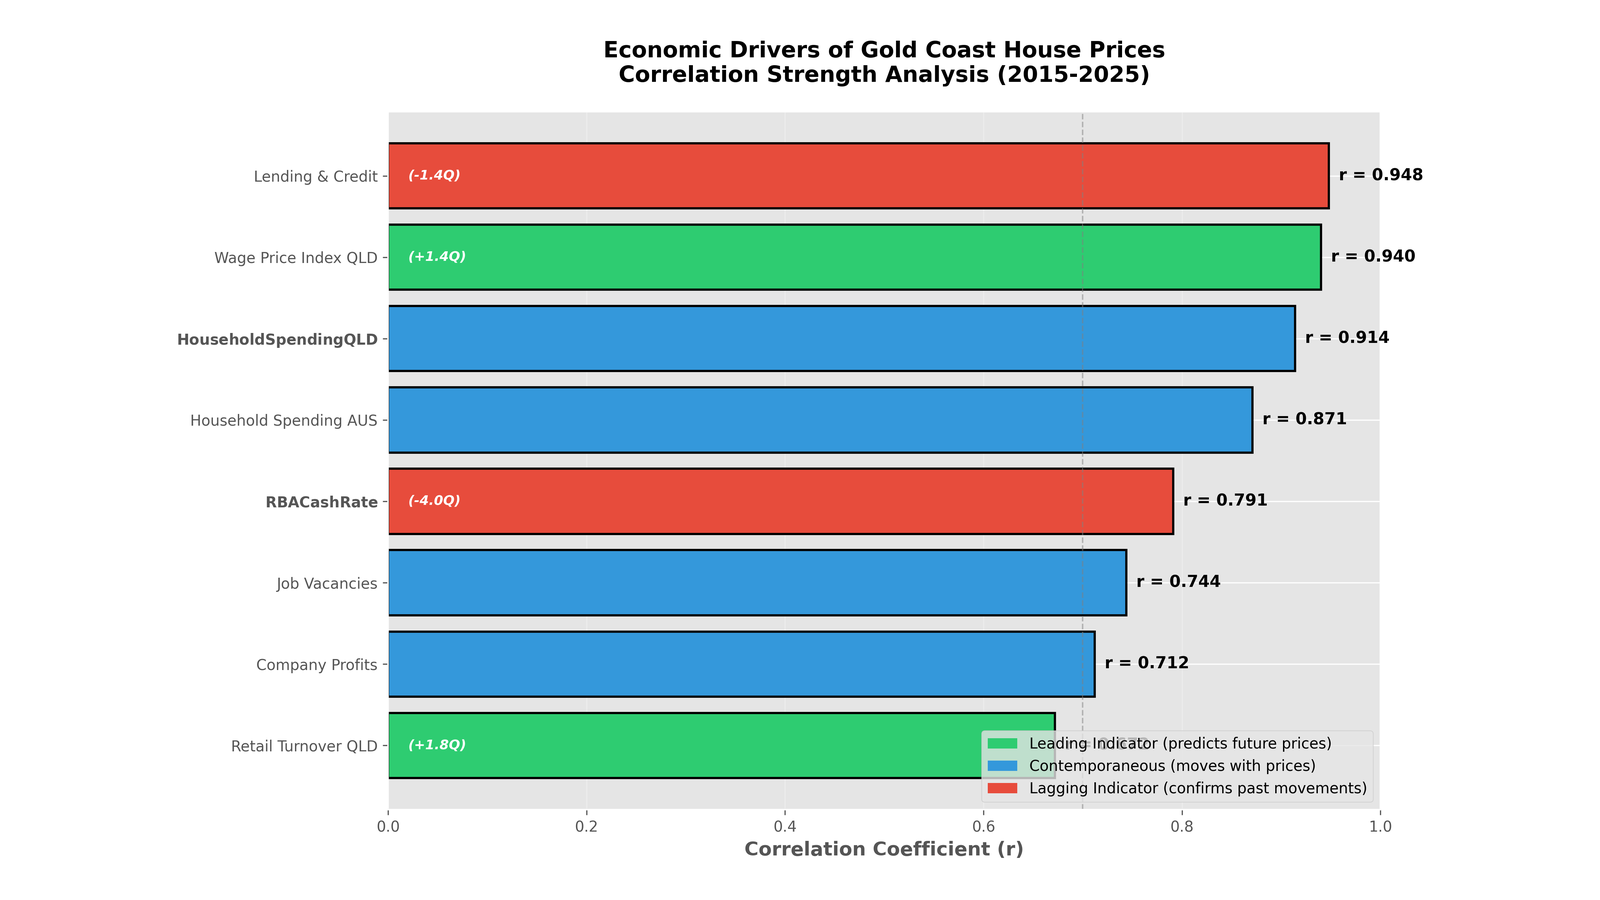

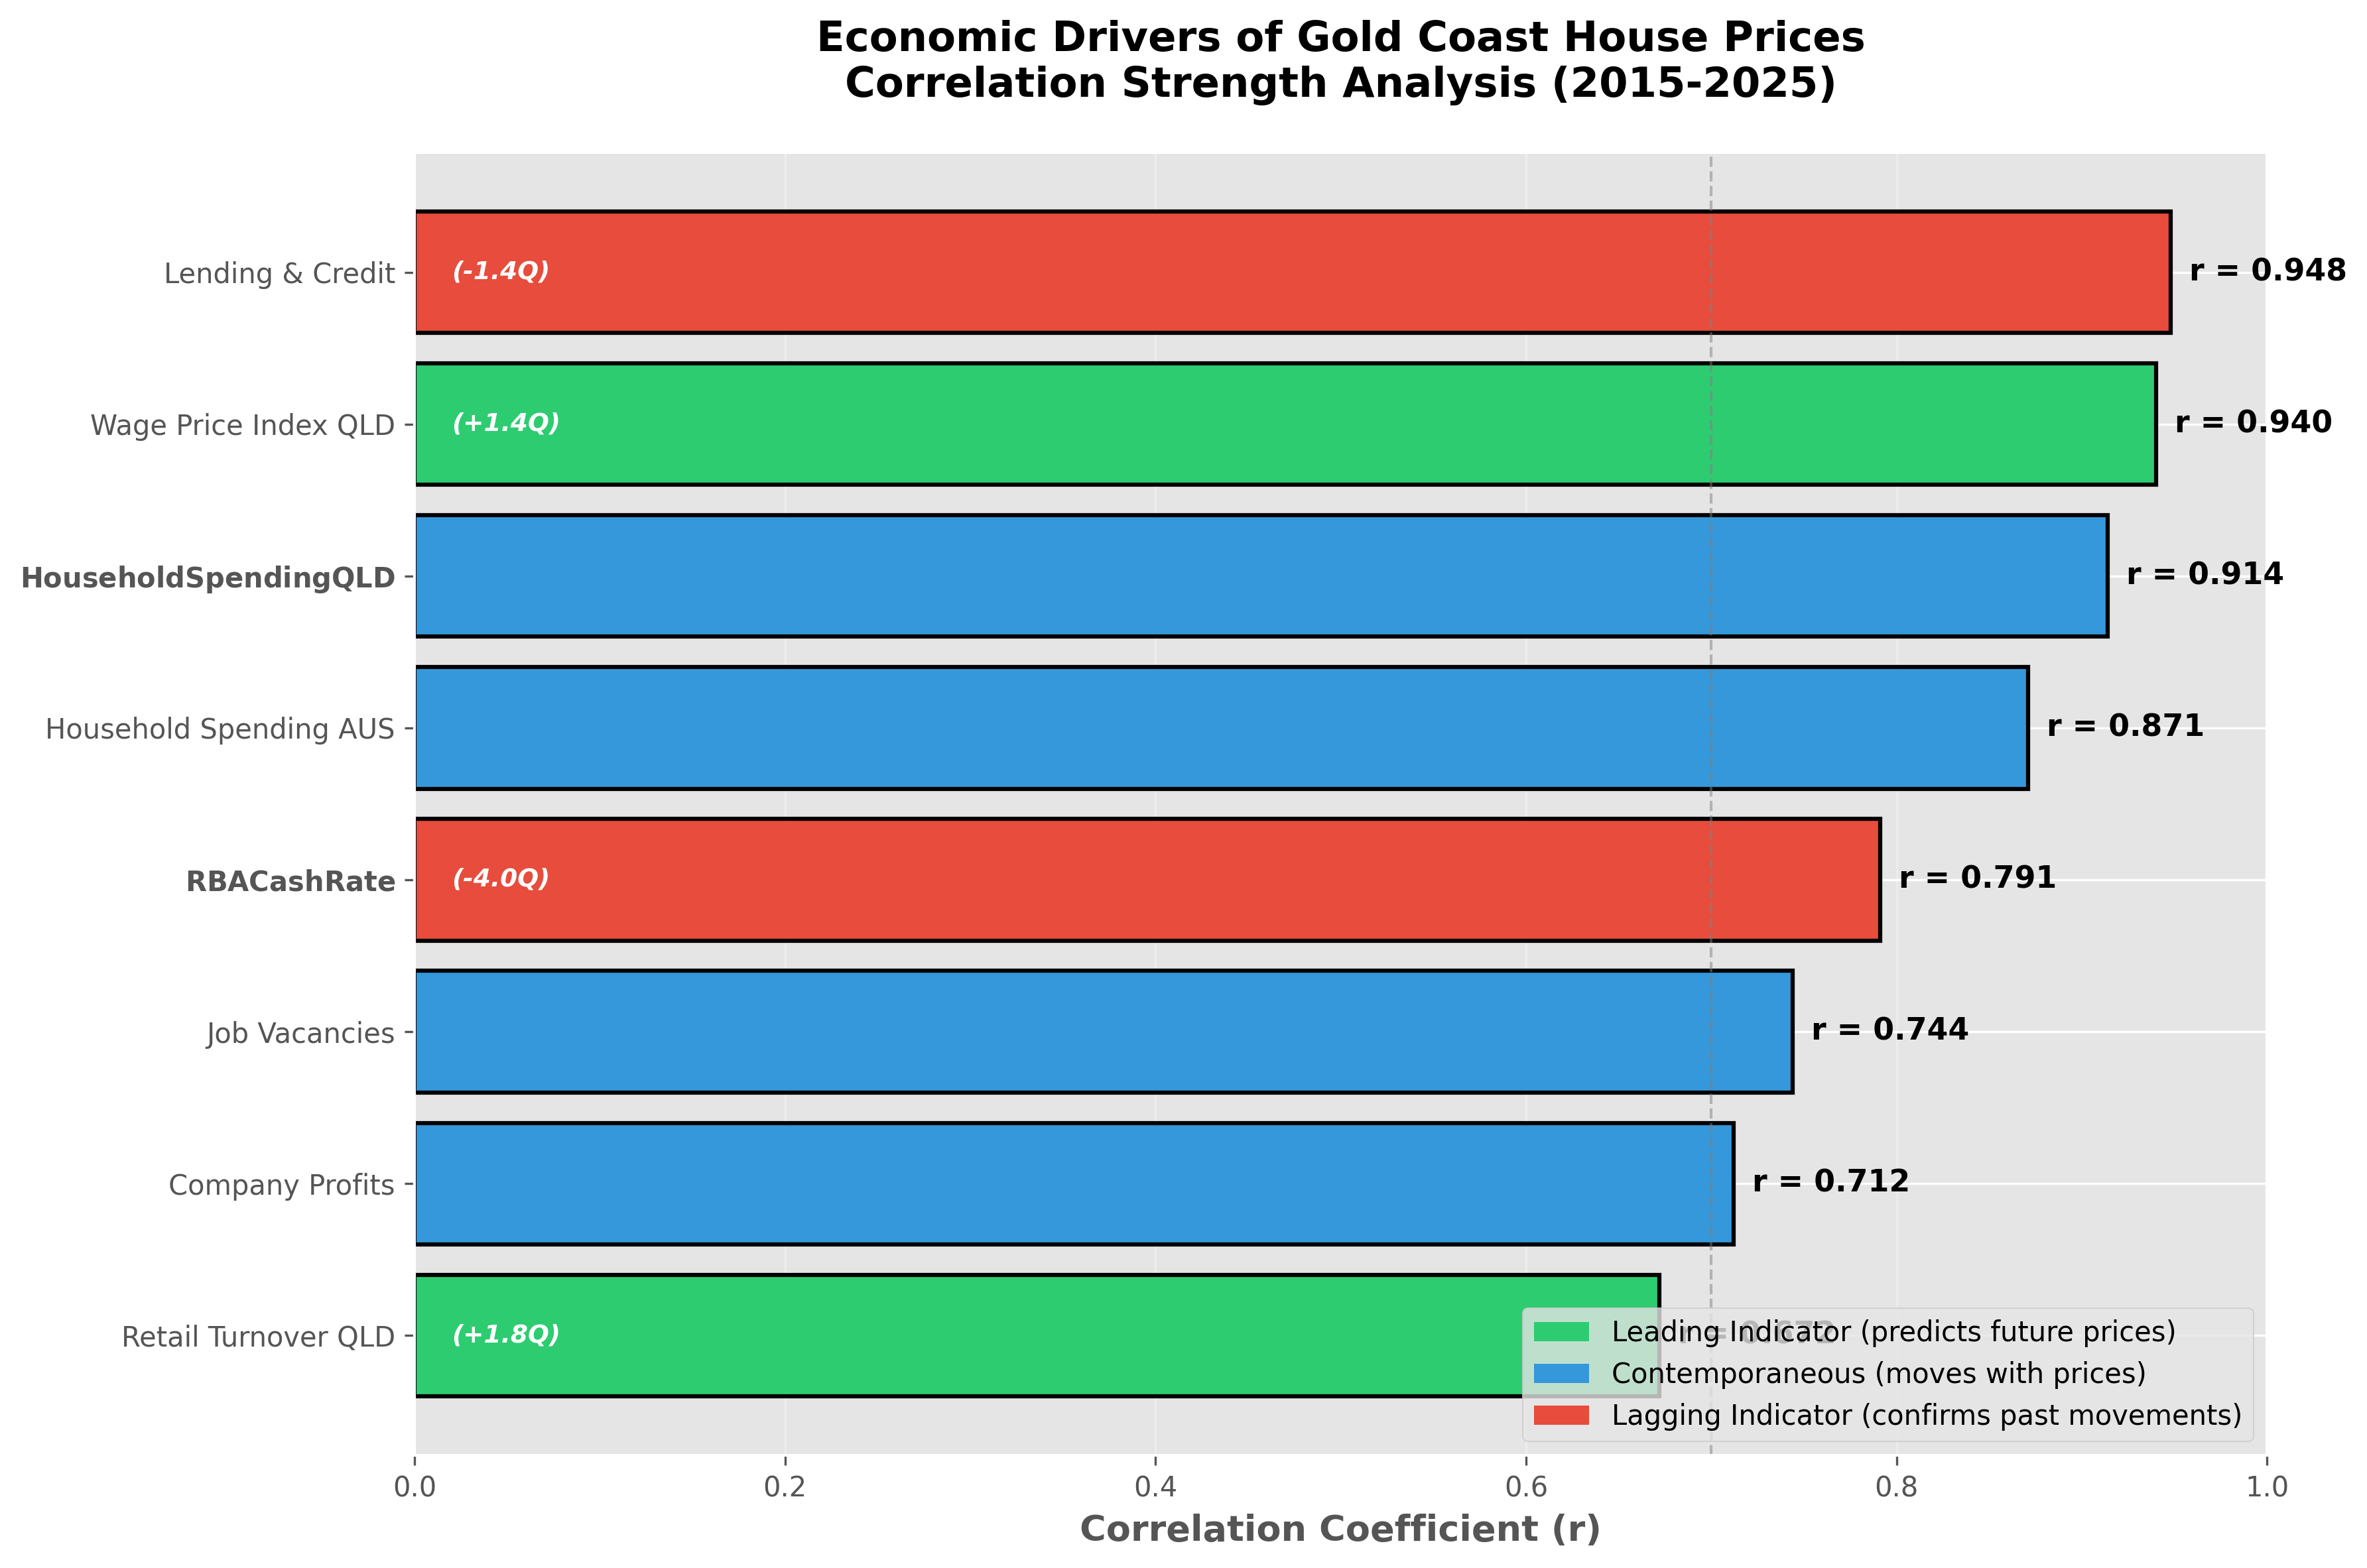 Figure 1: Correlation strength of economic indicators with Gold Coast house prices across 8 suburbs