19 John Francis Drive
Sold 18 February 2026 · 0.00 km away
Sold for
$1,685,000
Adjusted to this home
$1,685,000
 Smarter with data.
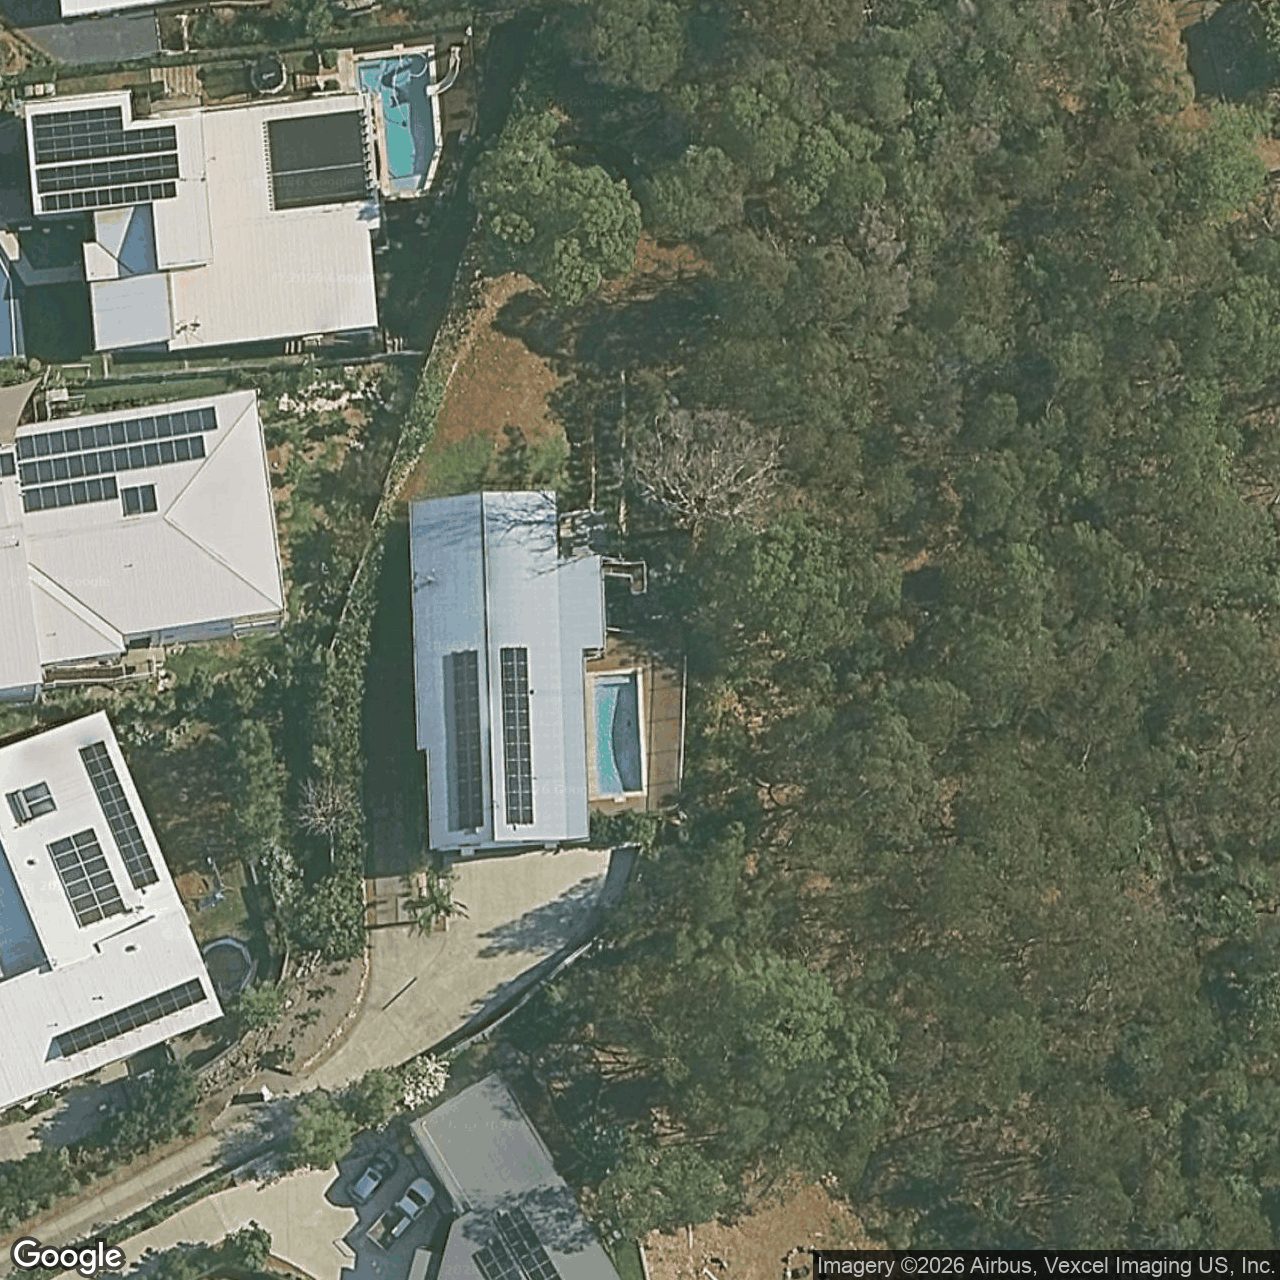
Last recorded sale: $850,000 in July 2019.
Comparable range
$1,332,703 – $1,982,479
8 adjusted comparable sales · 8 verified · 18 of 29 candidate sales verified · band ±19.6% measured on 146 sales · recomputed 19 October 2026
A sale down the road is not evidence until it is adjusted for how it differs from this home. Here is each sale we used, what we changed, and by how much.
Sold 18 February 2026 · 0.00 km away
Sold for
$1,685,000
Adjusted to this home
$1,685,000
Sold 16 February 2026 · 1.44 km away
Sold for
$1,750,000
Adjusted to this home
$1,606,864
| Land size | this home 3874 m² · comparable 1069 m² | +$141,372 |
|---|---|---|
| Condition | this home 8 · comparable 9 | −$105,000 |
| Floor area | this home 210 m² · comparable 309 m² | −$100,346 |
| Micro-location | this home -0.0311 · comparable 0.0265 | −$80,640 |
| Year built | this home 2012 · comparable 1987 | +$38,500 |
| Street | this home 0.1263 · comparable 0.15 | −$33,180 |
| Car spaces | this home 2 · comparable 4 | −$18,242 |
| Cladding | this home 3 · comparable 2 | +$14,400 |
| Net adjustment | −$143,136 |
A further 10 factors were compared and found the same on both properties, so no money moved.
Sold 14 November 2025 · 2.64 km away
Sold for
$1,580,000
Adjusted to this home
$1,599,546
| Micro-location | this home -0.0311 · comparable 0.15 | −$228,910 |
|---|---|---|
| Land size | this home 3874 m² · comparable 279 m² | +$181,188 |
| Bedrooms | this home 5 · comparable 4 | +$70,914 |
| Street | this home 0.1263 · comparable 0.082 | +$55,995 |
| Storeys | this home 1 · comparable 2 | −$55,968 |
| Water views | this home 0 · comparable 1 | −$22,352 |
| Floor area | this home 210 m² · comparable 188 m² | +$22,299 |
| Cladding | this home 3 · comparable 4 | −$14,400 |
| Year built | this home 2012 · comparable 2005 | +$10,780 |
| Net adjustment | +$19,546 |
A further 9 factors were compared and found the same on both properties, so no money moved.
Sold 16 February 2026 · 0.21 km away
Sold for
$1,400,000
Adjusted to this home
$1,500,496
| Land size | this home 3874 m² · comparable 742 m² | +$157,853 |
|---|---|---|
| Bedrooms | this home 5 · comparable 6 | −$70,914 |
| Pool | this home 1 · comparable 0 | +$52,000 |
| Floor area | this home 210 m² · comparable 241 m² | −$31,422 |
| Car spaces | this home 2 · comparable 3 | −$9,121 |
| Year built | this home 2012 · comparable 2007 | +$7,700 |
| Micro-location | this home -0.0311 · comparable -0.0261 | −$5,600 |
| Net adjustment | +$100,496 |
A further 11 factors were compared and found the same on both properties, so no money moved.
Sold 1.12 km away
Sold for
$1,249,000
Adjusted to this home
$1,548,759
| Land size | this home 3874 m² · comparable 786 m² | +$114,714 |
|---|---|---|
| Street | this home 0.1263 · comparable -0.0081 | +$98,983 |
| Floor area | this home 210 m² · comparable 269 m² | −$44,078 |
| Pool | this home 1 · comparable 0 | +$38,327 |
| Condition | this home 8 · comparable 7 | +$36,824 |
| Year built | this home 2012 · comparable 1980 | +$36,322 |
| Bathrooms | this home 3 · comparable 2 | +$32,431 |
| Micro-location | this home -0.0311 · comparable 0.002 | −$24,378 |
| Cladding | this home 3 · comparable 2 | +$10,614 |
| Net adjustment | +$299,759 |
A further 9 factors were compared and found the same on both properties, so no money moved.
Sold 14 May 2026 · 1.30 km away
Sold for
$1,560,000
Adjusted to this home
$1,764,611
| Land size | this home 3874 m² · comparable 765 m² | +$156,694 |
|---|---|---|
| Condition | this home 8 · comparable 6 | +$124,800 |
| Micro-location | this home -0.0311 · comparable 0.0219 | −$66,144 |
| Floor area | this home 210 m² · comparable 263 m² | −$53,721 |
| Pool | this home 1 · comparable 0 | +$52,000 |
| Street | this home 0.1263 · comparable 0.15 | −$29,578 |
| Cladding | this home 3 · comparable 2 | +$14,400 |
| Year built | this home 2012 · comparable 2008 | +$6,160 |
| Net adjustment | +$204,611 |
A further 10 factors were compared and found the same on both properties, so no money moved.
Sold 9 April 2026 · 0.46 km away
Sold for
$1,260,000
Adjusted to this home
$1,562,400
| Street | this home 0.1263 · comparable -0.0701 | +$80,447 |
|---|---|---|
| Land size | this home 3874 m² · comparable 695 m² | +$65,107 |
| Condition | this home 8 · comparable 6 | +$40,961 |
| Floor area | this home 210 m² · comparable 119 m² | +$37,482 |
| Bedrooms | this home 5 · comparable 4 | +$28,816 |
| Pool | this home 1 · comparable 0 | +$21,130 |
| Bathrooms | this home 3 · comparable 2 | +$17,880 |
| Year built | this home 2012 · comparable 1991 | +$13,142 |
| Cladding | this home 3 · comparable 2 | +$5,851 |
| Micro-location | this home -0.0311 · comparable -0.0196 | −$4,710 |
| Car spaces | this home 2 · comparable 3 | −$3,706 |
| Net adjustment | +$302,400 |
A further 7 factors were compared and found the same on both properties, so no money moved.
Sold 2 June 2026 · 2.62 km away
Sold for
$1,650,000
Adjusted to this home
$1,843,785
| Land size | this home 3874 m² · comparable 1385 m² | +$125,446 |
|---|---|---|
| Street | this home 0.1263 · comparable 0.0425 | +$110,616 |
| Condition | this home 8 · comparable 9 | −$99,000 |
| Micro-location | this home -0.0311 · comparable 0.0319 | −$83,160 |
| Bedrooms | this home 5 · comparable 4 | +$70,914 |
| Bathrooms | this home 3 · comparable 2 | +$44,000 |
| Year built | this home 2012 · comparable 1990 | +$33,880 |
| Cladding | this home 3 · comparable 2 | +$14,400 |
| Floor area | this home 210 m² · comparable 224 m² | −$14,190 |
| Car spaces | this home 2 · comparable 3 | −$9,121 |
| Net adjustment | +$193,785 |
A further 8 factors were compared and found the same on both properties, so no money moved.
We are not claiming to be more accurate than anyone else. We are showing you the sales, the adjustments and the band they produce, so you can judge the number yourself.

“Prices are holding for now, but we need to be watching inflation, household spending, and wage growth as leading indicators of where the market moves next.”Will SimpsonFields Real Estate
Gold Coast homes listed for 60 to 180 days rose from 1,288 in March to 2,618 in August (SQM Research). A rising count of homes sitting unsold has historically been associated with downward pressure on asking prices.
But property markets do not move as one—and neither do individual homes.
We traced the estimated value of 19 John Francis Drive over the past 18 months, compared it with Carrara’s wider market, and examined the indicators most likely to reveal what happens next.
Enter your address to unlock its comparable sales range, condition score and what else is for sale on your street.

The full comparable-sales assessment for this home — the evidence, adjustment grid and reconciliation behind the range. The same report you can open above.

The document we prepare before a home goes to market — valuation evidence, comparables and market position, with a cover prepared for this address.
The recent nearby sales adjusted to this home, weighed against the national headlines — the same report you can open above.