

9 Des Quinlan Crescent, Tallebudgera
Sold in 33 days · Private treaty
9 Des Quinlan Crescent sold for $2,375,000 on 23 May 2026, 33 days after it was listed. That is $1,070,000 more than it sold for in Feb 2020.
It is a house on a 5156 m² block.
- Listed
- 20 Apr 2026
- Sold
- 23 May 2026
- Days on market
- 33
- Method
- private treaty
- Previous sale
- $1,305,000 · Feb 2020
- Sales on record
- 5 since 2001
33 days, against every Tallebudgera house sale in the year to it
Each dot is a Tallebudgera house sold between 23 May 2025 and 23 May 2026 with a published price. Left is faster; up is dearer.
55.5 daysMedian time to sell for a Tallebudgera house in the year to this sale (6 sales).
17%of those sales took fewer than 33 days.
5 sales, and the suburb around them
The line is Tallebudgera's median house price over rolling 12 months. The dots are every recorded sale of 9 Des Quinlan Crescent.
Its lowest sale against the suburb median was 57%, in 2001; its highest, 140% in 2016. Between its last two sales it rose 82.0%. Tallebudgera's median house price rose 129.8% over the same period.
Tallebudgera's rolling median was $2,170,000 in the 12 months to March 2026 and $2,195,000 in the 12 months to September 2026.
| Sold | Price | Suburb median | Ratio |
|---|---|---|---|
| Feb 2001 | $135,900 | $240,500 | 57% |
| Jul 2007 | $860,000 | $659,250 | 130% |
| May 2016 | $1,100,000 | $785,000 | 140% |
| Feb 2020 | $1,305,000 | $955,000 | 137% |
| May 2026 | $2,375,000 | $2,195,000 | 108% |
When did you buy in Tallebudgera?
Bought in 2008: the Tallebudgera median house was $675,000. In the 12 months to September 2026 it was $2,195,000, 3.3 times as much.
A suburb median describes the typical sale, not your home. Your own address has its own record. Look it up.
What the buyer got for $2,375,000
Block, land, flood height, rooms and condition, from survey, laser and photo data.
The block
5156 m² · Freehold
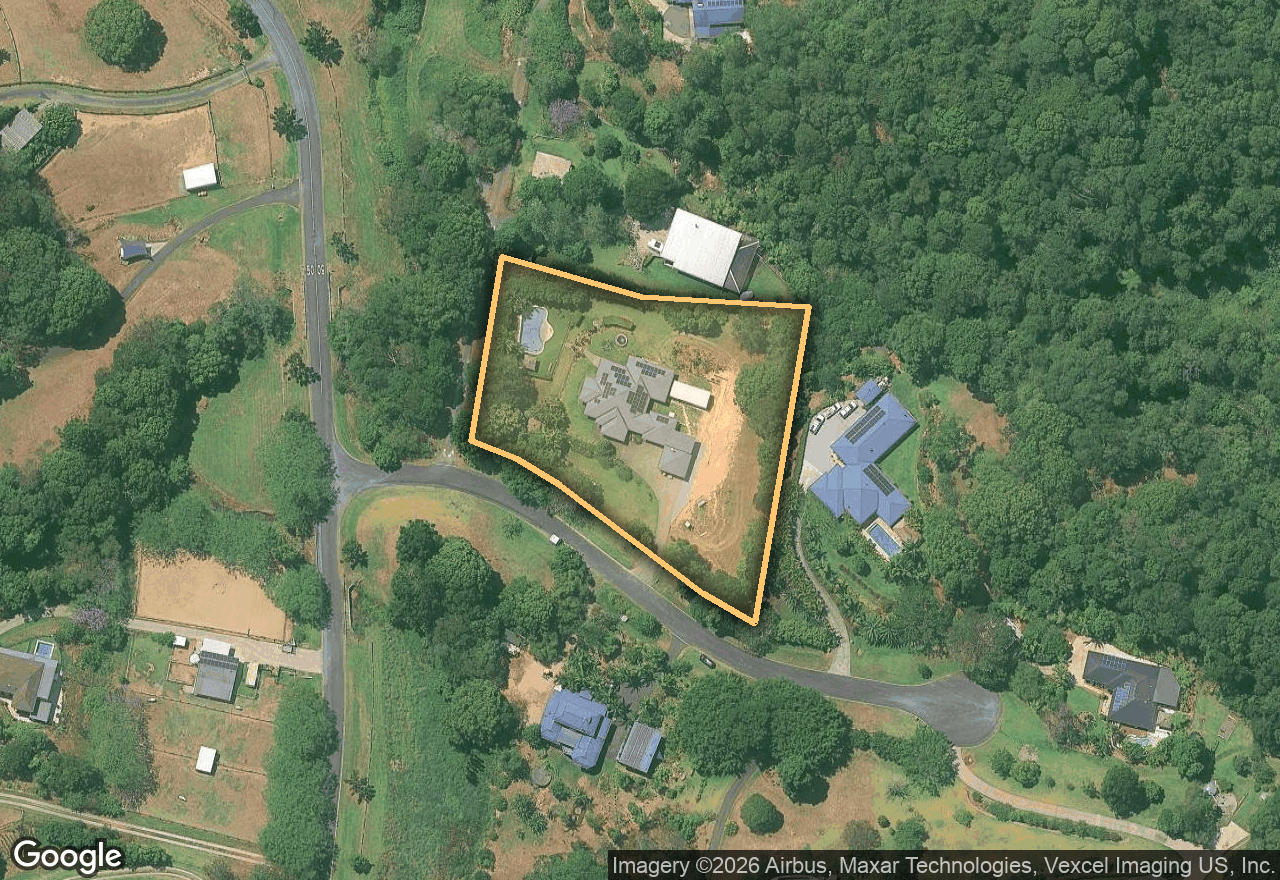
Building
- Internal living
- 336 m²
- Roof footprint
- 478 m²
- Roof height
- 5 m
- Ground level
- 63 m
Roof footprint and height from the 2022 laser survey of the Gold Coast.
Location
- Varsity Lakes station
- 19 min drive
- Palm Beach
- 17 min drive
- Old Burleigh Town Centre
- 16 min drive
- John Flynn Private Hospital
- 23 min drive
- Ingleside State School (primary catchment)
- In zone
- Elanora State High School (junior secondary catchment)
- In zone
- Surfers Paradise
- 31 min drive
- Gold Coast Airport
- 23 min drive
- Robina Town Centre
- 21 min drive
- Burleigh Beach
- 18 min drive
What the buyer paid on top
- Transfer duty, owner-occupier
- $109,913
- Transfer duty, investor
- $117,088
Queensland Revenue Office schedule applied to $2,375,000.
Your home has a page like this too
Its own sales record, its block measured by laser survey, its flood height, and the sales around it.
Look up your home
Every home in Tallebudgera and the suburbs around it: its sales record, its block and the sales nearest it.
Hear when the next one sells near here
An email from Will when houses like this one sell within 1.5 km of 9 Des Quinlan Crescent: the recorded price, the days it took and how its campaign ran. Only when something sells, at most once a week. Unsubscribe in one click.