What do comparable sales say about your home?Your home vs recent sales
Enter your address to see the comparable sales around it. Free, no sign-up.Free comparable sales for your address.
🔍
Analyst21 August 2026·Updated 15 September 2026·6 min read
Gold Coast market update — August 2026
While Brisbane has turned down and the southern capitals are falling, the Gold Coast has plateaued — up about 7.8% over the year but flat in recent months. What's holding it, and why the citywide figure hides three different suburbs.
While the national headlines describe falling prices, the Gold Coast has done something quieter: it has stopped rising, without falling. That distinction is the whole story this month.
Nationally, dwelling values fell 0.7% in July, led by Sydney (down 4.0% over the quarter) and Melbourne (3.4%). Brisbane, the strongest capital of recent years, has now turned down too — 0.6% over both the month and the quarter. The Gold Coast has held. On PropTrack’s Gold Coast measure, the median dwelling was $1.18 million in June — a fall of 0.3%, its first monthly dip in about four years — and then effectively flat in July at $1.182 million, up around 7.8% over the year. Not rising, not falling: a plateau.
A plateau, not a fall
A plateau after a long climb is a normal and fairly benign thing. It means buyers and sellers have, for now, found a level they broadly agree on: enough buyers to hold prices where they are, not enough competition to push them higher.
It is worth being clear about the measure. There is no Gold Coast-specific reading from Cotality, the index most national coverage quotes — Cotality reports at the Brisbane city level. The Gold Coast figures here are PropTrack’s, which does publish a Gold Coast series. Different compilers produce different numbers for the same place, so the useful comparison is not one index against another but the Gold Coast against itself over time: up strongly across the year, flat in the most recent months.
What sits underneath it
Three longer-run supports explain why the Gold Coast has plateaued rather than followed the southern capitals down.
Migration, still inbound but easing. Queensland remains the country’s top state for interstate migration, and the Gold Coast absorbs a large share of it. The pace has moderated — Queensland’s net interstate gain eased from about 21,600 in the year to June 2025 to about 16,500 in the year to December 2025 — but it is still positive, and the state’s population grew 1.6% over the year. (These are Queensland-level figures; no clean Gold Coast-only count for 2026 exists, so this is regional context rather than a local tally.)
A rental market that is still tight. Gold Coast vacancy loosened a little over the June quarter, to a reported 1.1–1.5%, but that remains well below the 2.6–3.5% the REIQ treats as balanced. Median rents are about $950 a week for a house and $850 for a unit. A tight rental market keeps a floor under values by making ownership the alternative to a scarce and expensive rental.
Chronic undersupply. New housing across the country is running well short of the national targets — approvals and completions are both materially below where the Housing Accord aimed — and a construction labour shortage is forecast to keep supply constrained. Fewer new homes than the population needs is the single most durable support under South East Queensland values.
Infrastructure: one line opened, one was cancelled
The Gold Coast’s transport map changed this month, in both directions.
Light Rail Stage 3 opened on 9 August — a 6.7-kilometre extension from Broadbeach South to Burleigh Heads, adding eight stops and taking the network to 27 kilometres, at a cost of $1.55 billion.
Stage 4, which would have run from Burleigh Heads to Coolangatta, has been cancelled. In its place, a “GC Surfer” bus network will serve the southern corridor — buses without dedicated lanes, also linking Nerang and Robina. It is a material change to the southern end of the city’s transport plan, and one worth knowing about factually, whatever one makes of it.
Beyond the tram, the region carries a genuine infrastructure tailwind from the 2032 Games — though it is worth being precise about scale. The headline $7.1 billion venue-infrastructure program is Queensland-wide, not Gold Coast spending (the Commonwealth is contributing $3.435 billion across the state). The Gold Coast’s own share includes athlete-village planning and a reported ~$20 million upgrade to the Gold Coast Hockey Centre at Labrador. Substantial, but a regional slice of a state program rather than a city windfall.
But “the Gold Coast” is not one market
The plateau is a citywide average, and a citywide average tells a homeowner very little about their own street. Underneath it, individual suburbs are moving in different directions.
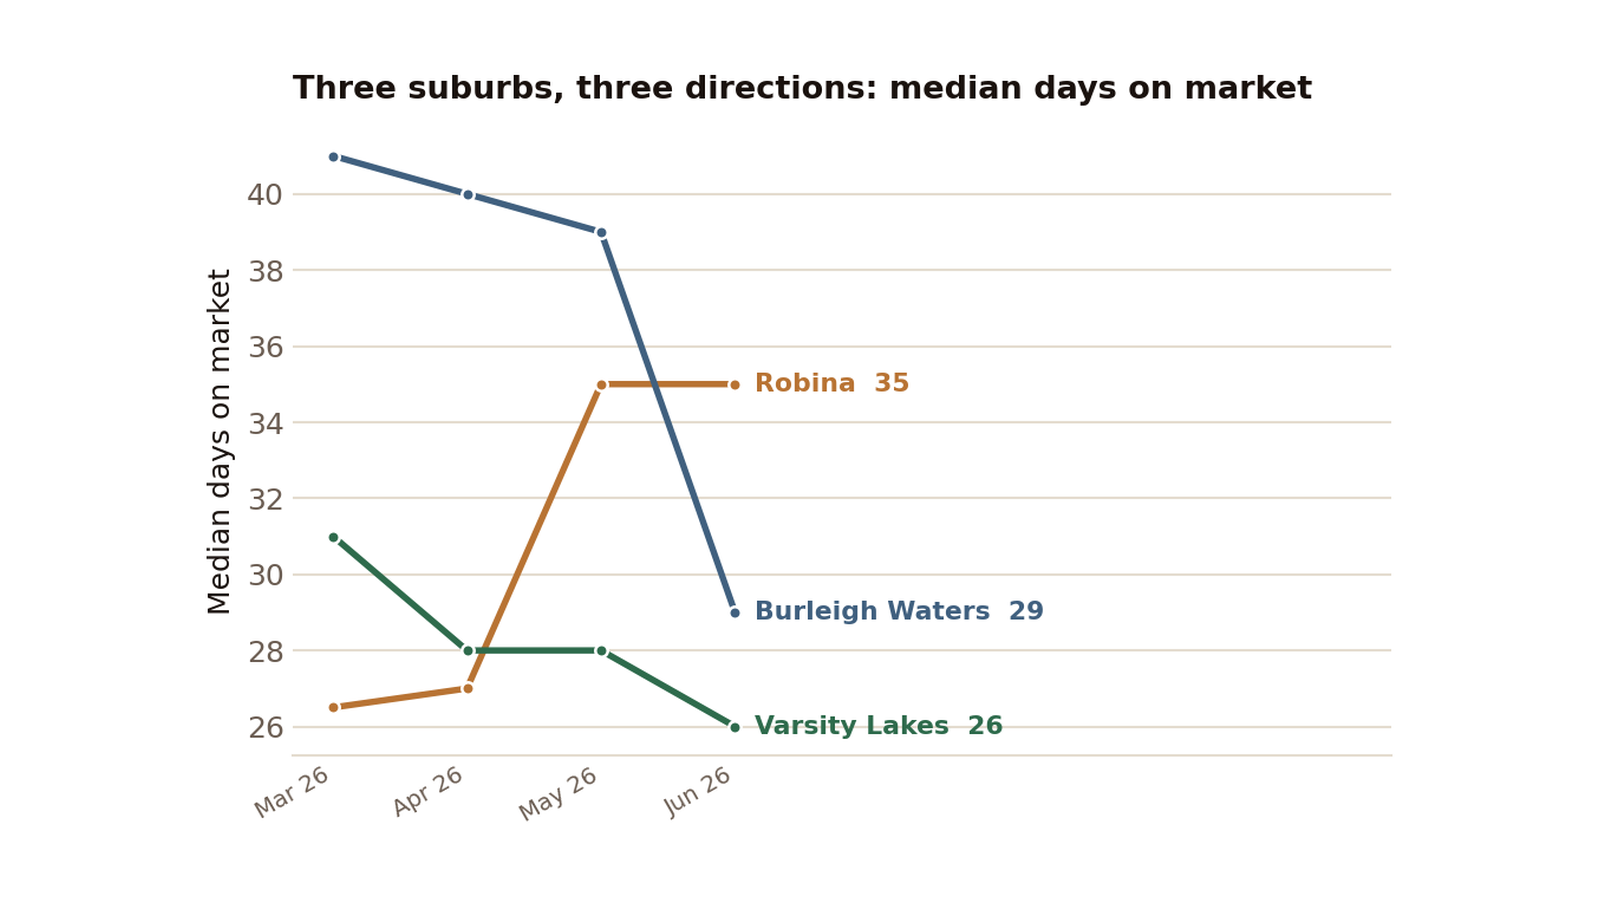
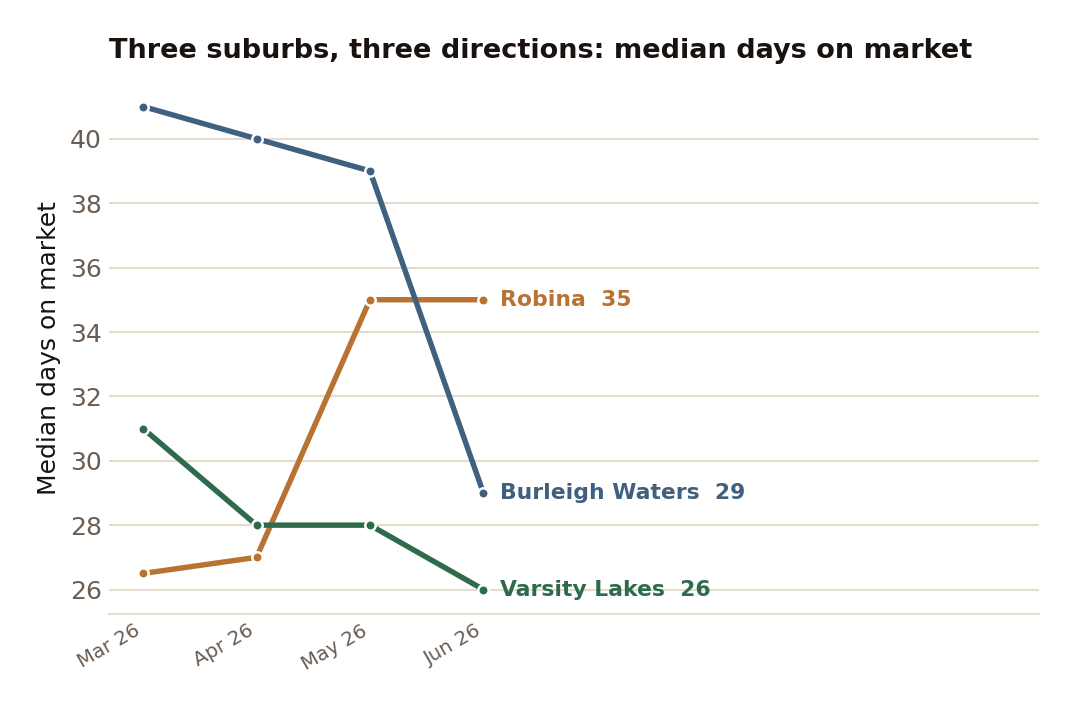
In our three tracked suburbs, the past year has pulled them apart rather than together: Robina has slowed markedly, with homes taking about a third longer to sell than a year ago; Burleigh Waters has softened in the most recent months after a strong run; and Varsity Lakes has held firm, the only one of the three still selling above asking. One region, three directions.
Median days on market, three-month rolling. Behind the citywide plateau, the suburbs diverge — Robina lengthening, Burleigh Waters easing off a strong run, Varsity Lakes steady.
Our separate updates for Robina, Varsity Lakes and Burleigh Waters set out where each of those markets actually sits.
What we are leaving out
A few things circulate about the Gold Coast that the evidence does not support well enough to publish. There is no reliable Gold Coast-specific days-on-market or listings figure from an external source, so the suburb detail above is our own. No major corporate relocation to the city was announced this year, so we are not describing a relocation boom, though the City does run an investment-attraction program. And the forecast that the Gold Coast will overtake Sydney as the country’s most expensive market rests on data that predates the recent plateau — a forecast, not a fact, and not one we will repeat as though it were settled.
Where that leaves things
The Gold Coast has come off the boil rather than fallen off a cliff. Its longer-run supports — migration, a tight rental market, undersupply and a decade of infrastructure — are still in place. Its near-term signal has flattened, in step with a softening national backdrop and a Brisbane market that has turned. Both are true at once, and which matters more depends on whether you are looking at the next decade or the next few months.
Sources: PropTrack Gold Coast dwelling values, June–July 2026 (reported via Hot Tomato and Black Swan Property Group). National and capital-city context: Cotality (formerly CoreLogic) Home Value Index, July 2026. Migration: ABS, to December 2025. Rental market: REIQ, June quarter 2026 (via ABC News). Infrastructure: Queensland Government, 23 June 2026; ABC News, 9 August 2026. Suburb data: Fields Estate, compiled from public sale records, twelve months to 2 August 2026. Figures as at publication.
Keep reading:Gold Coast market data — prices, supply and selling times, updated as new sales settle.
Licensed Queensland real estate agent, founder of Fields Real Estate and Lead Analyst at Fields Research. Covering Gold Coast market data, comparable sales analysis and suburb intelligence.
Where does your own home sit?
Fields keeps a record of every active listing and recent sale across the southern Gold Coast, and reads any address against the sales around it — the comparables, the range they support, and the method behind it. This analysis of the Gold Coast comes from the same database.